Bug introduced in 8.0 and fixed in 9.0
I have a list of data dpdOt (given below) with associated angular coordinates thetaplot, which when plotted using
    thetaplot = Table[tt,{tt,0,2*Pi,2*Pi/300}]
    ListPlot[Transpose[{thetaplot/Pi 180, dpdOt}], Joined -> True, PlotRange -> All]
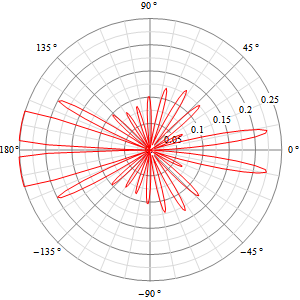
looks like this:
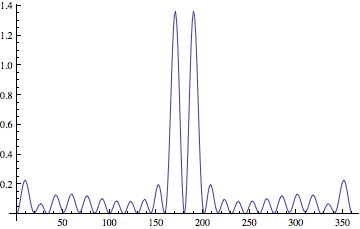
However, I'd rather see this plotted as a ListPolarPlot, but I am having trouble with PlotRange. For example, when I use the command
    ListPolarPlot[Transpose[{thetaplot, dpdOt}],
      Joined -> True, PolarAxes -> True,
      PolarTicks -> {"Degrees", Automatic},
      PolarGridLines -> True, PlotRange -> All]
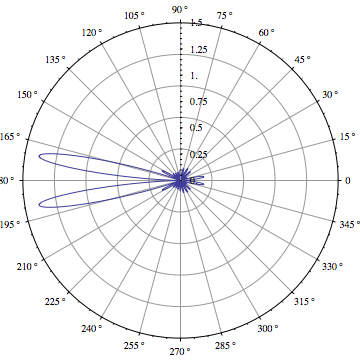
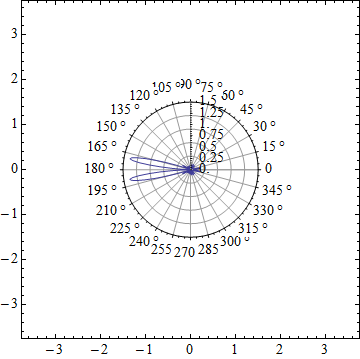
I get the following plot:
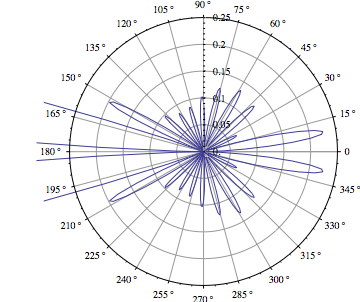
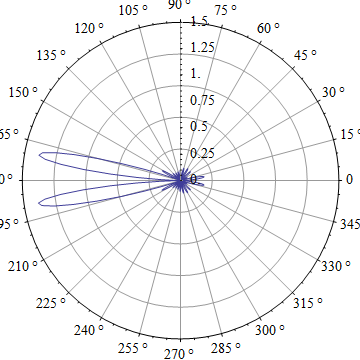
which is obviously not plotting the full data range. If I try and manually set PlotRange -> 1.5, Mathematica merely gives me a zoomed out version of the same polar plot:
Does anybody have any idea how I can get Mathematica to show the full dataset on my polar plot?
The dataset is:
dpdOt = {0.`, 0.009554081538201524`, 0.03657921246993372`, 0.07645719594918586`, 0.1224134613324866`, 0.16671965853831489`, 0.2020509236272155`, 0.22274769290832974`, 0.22575257105691635`, 0.21105662334588893`, 0.18158393497377667`, 0.14254991938921568`, 0.10042704400882534`, 0.06172261938230206`, 0.03180381202988293`, 0.013989865520678359`, 0.009074375607003422`, 0.015353199348562318`, 0.029133703291304467`, 0.045608259290746044`, 0.059907143344449666`, 0.06811602801815318`, 0.06805619079404875`, 0.05967798355792369`, 0.044998917623994925`, 0.027610426330823622`, 0.011863439428043385`, 0.001905442213411619`, 0.0007687312281260307`, 0.009696350336090554`, 0.027841942524898654`, 0.05240297090682485`, 0.07915899837109333`, 0.10330545634013048`, 0.12041455169350666`, 0.1273300195707255`, 0.12281593359315725`, 0.10782877955797118`, 0.08535664034364425`, 0.0598548826381265`, 0.0363874297112553`, 0.01964103546890816`, 0.013005632519217386`, 0.017901837073488084`, 0.03348933529492066`, 0.05681622331866217`, 0.08338356368455244`, 0.10801797869739073`, 0.1258838157458027`, 0.13343735028386552`, 0.12913464839968958`, 0.11375083606637912`, 0.09024321729842082`, 0.0631798709645865`, 0.03784184580594409`, 0.01917378839552386`, 0.010791123900980252`, 0.014244303123378875`, 0.028692550180028028`, 0.051059513247240756`, 0.07664648824951373`, 0.10008465443777814`, 0.11643545518106532`, 0.12221354284042615`, 0.11611806246510771`, 0.09931464269298441`, 0.07520186774030126`, 0.048703952993848255`, 0.025233271631061455`, 0.009540102126567822`, 0.004695564232203329`, 0.011429494446618007`, 0.027971655343629113`, 0.050436902199565224`, 0.07367569127391489`, 0.0924069287274574`, 0.10238447666431386`, 0.1013374846275298`, 0.08947198471813812`, 0.06941749674225801`, 0.04562682130072883`, 0.02336179577963223`, 0.007493854962987605`, 0.00139302722259097`, 0.006161200150237524`, 0.020388179378757983`, 0.04048931173627752`, 0.06154859929889949`, 0.078472675688499`, 0.08718681535608698`, 0.08559234035384577`, 0.07405894111973076`, 0.05533354561614883`, 0.03388451541925968`, 0.014833968423679648`, 0.0027301058954676103`, 0.00045163413523262254`, 0.008507481364097463`, 0.024903075095984252`, 0.0456105809967408`, 0.06553606471258362`, 0.0797558049558498`, 0.08472607856766433`, 0.0791726455592892`, 0.06443855291626575`, 0.04419570077716716`, 0.023577636442966548`, 0.007932512944609768`, 0.001492113602352463`, 0.006281152280129452`, 0.021542228899509474`, 0.04383535778027103`, 0.06781257671823812`, 0.08750405559279266`, 0.0978210472734063`, 0.09591516988165438`, 0.08205096374581881`, 0.05974878090823095`, 0.03511799119091121`, 0.015491056611719418`, 0.007644208098589879`, 0.016008842898051462`, 0.041308975498834125`, 0.0799920698716276`, 0.12466309845912157`, 0.16551502191459355`, 0.19251813998620537`, 0.1979365219231554`, 0.1786272840234142`, 0.1375777607510681`, 0.08425397825386047`, 0.0335534665496219`, 0.0034359646772461074`, 0.011591552251972725`, 0.07173765420231708`, 0.19026282194703806`, 0.3639239411625669`, 0.5791488923696507`, 0.813221884473814`, 1.037282176743776`, 1.2207136698253551`, 1.3362119128823164`, 1.3646459208863824`, 1.2988226517976427`, 1.1454201179472137`, 0.9246567650991964`, 0.6676574849266789`, 0.4118891574170705`, 0.19539424083596366`, 0.050782165477450084`, 0.`, 0.050782165477450084`, 0.19539424083596366`, 0.4118891574170705`, 0.6676574849266789`, 0.9246567650992072`, 1.1454201179472137`, 1.2988226517976427`, 1.3646459208863868`, 1.33621191288231`, 1.2207136698253502`, 1.0372821767437717`, 0.813221884473814`, 0.5791488923696507`, 0.36392394116255933`, 0.19026282194703142`, 0.07173765420231298`, 0.011591552251971629`, 0.0034359646772465858`, 0.033553466549622345`, 0.08425397825386129`, 0.13757776075106873`, 0.17862728402341452`, 0.1979365219231553`, 0.19251813998620523`, 0.16551502191459352`, 0.12466309845912063`, 0.07999206987162717`, 0.04130897549883387`, 0.016008842898051108`, 0.00764420809858988`, 0.015491056611719966`, 0.0351179911909119`, 0.05974878090823171`, 0.08205096374581904`, 0.0959151698816545`, 0.0978210472734063`, 0.08750405559279249`, 0.06781257671823812`, 0.04383535778027089`, 0.02154222889950937`, 0.006281152280129231`, 0.001492113602352463`, 0.0079325129446096`, 0.023577636442966645`, 0.044195700777166905`, 0.06443855291626631`, 0.0791726455592894`, 0.08472607856766434`, 0.07975580495584968`, 0.06553606471258311`, 0.045610580996740674`, 0.0249030750959836`, 0.008507481364097328`, 0.00045163413523252865`, 0.0027301058954676857`, 0.014833968423680205`, 0.033884515419259915`, 0.05533354561614951`, 0.07405894111973105`, 0.08559234035384577`, 0.08718681535608702`, 0.078472675688499`, 0.061548599298899026`, 0.04048931173627754`, 0.020388179378757657`, 0.006161200150237425`, 0.0013930272225909912`, 0.007493854962987713`, 0.023361795779632825`, 0.04562682130072909`, 0.06941749674225874`, 0.08947198471813836`, 0.10133748462752992`, 0.10238447666431386`, 0.0924069287274574`, 0.07367569127391442`, 0.05043690219956524`, 0.027971655343628703`, 0.011429494446618017`, 0.0046955642322033106`, 0.009540102126567813`, 0.025233271631062083`, .04870395299384845`, 0.07520186774030205`, 0.09931464269298464`, 0.11611806246510807`, 0.12221354284042608`, 0.11643545518106499`, 0.10008465443777788`, 0.07664648824951395`, 0.05105951324724025`, 0.028692550180028028`, 0.014244303123378665`, 0.010791123900980252`, 0.01917378839552417`, 0.03784184580594409`, 0.06317987096458702`, 0.09024321729842102`, 0.11375083606637972`, 0.1291346483996897`, 0.13343735028386566`, 0.1258838157458027`, 0.1080179786973901`, 0.08338356368455223`, 0.05681622331866127`, 0.03348933529492036`, 0.017901837073488223`, 0.013005632519217408`, 0.01964103546890816`, 0.03638742971125556`, 0.059854882638126314`, 0.0853566403436447`, 0.10782877955797118`, 0.12281593359315748`, 0.1273300195707255`, 0.12041455169350626`, 0.10330545634013014`, 0.07915899837109269`, 0.052402970906824456`, 0.027841942524897894`, 0.009696350336090289`, 0.0007687312281258732`, 0.0019054422134117427`, 0.011863439428043385`, 0.02761042633082383`, 0.044998917623994925`, 0.0596779835579238`, 0.06805619079404875`, 0.06811602801815296`, 0.05990714334444941`, 0.04560825929074557`, 0.029133703291304193`, 0.015353199348562014`, 0.009074375607003374`, 0.013989865520678902`, 0.031803812029883506`, 0.06172261938230317`, 0.10042704400882617`, 0.14254991938921568`, 0.18158393497377667`, 0.21105662334588893`, 0.22575257105691635`, 0.22274769290832974`, 0.2020509236272155`, 0.16671965853831489`, 0.1224134613324866`, 0.07645719594918586`, 0.03657921246993372`, 0.009554081538201524`, 0.`}

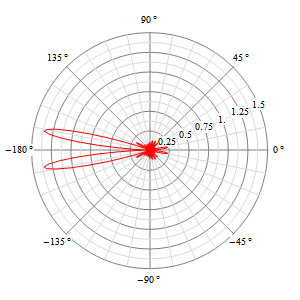
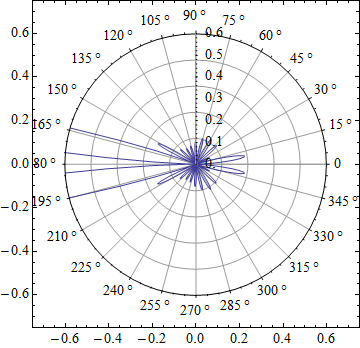
PlotRangePadding -> 0and/orImagePadding -> 0as well... please also include some sample data as well. I can't seem to reproduce it in some test data I created, but I do often encounter this annoyance with LPP $\endgroup$thethaplotis not defined andpishould bePi) $\endgroup$