6
$\begingroup$

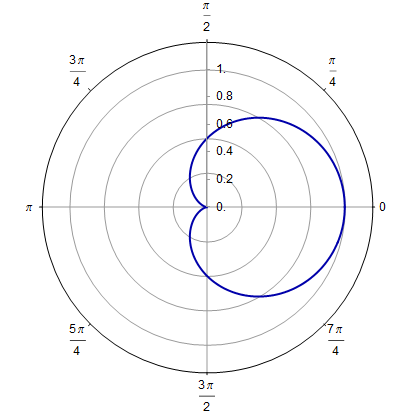
I'm trying to make a polar plot. The radial range (radius of the circle) is automatically set at 1.2. I want to change this to 1. My code is:

PolarPlot[Abs[1/2 (E^(I t) + 1)]^2, {t, 0, 2 π}, 
 PlotStyle -> {Darker[Blue], Thick},
 PolarAxes -> True,
 BaseStyle -> {FontFamily -> "Arial", FontSize -> 12},
 PolarTicks -> {{0, Pi/4, Pi/2, (3 Pi)/4, Pi, (5 Pi)/4, (3 Pi)/2, 
  (7 Pi)/4}, {0, .2, .4, .6, .8, 1}},
 PolarGridLines -> {{0, Pi/2, Pi, 3 Pi/2}, {0.25, 0.5, 0.75, 1}}]

enter image description here

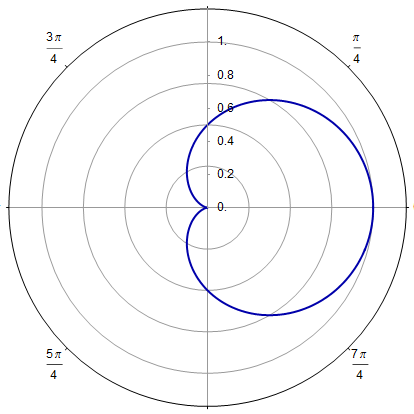
On the internet I found the command PlotRange -> 1, but this makes it even worse.

PolarPlot[Abs[1/2 (E^(I t) + 1)]^2, {t, 0, 2 π}, 
 PlotStyle -> {Darker[Blue], Thick},
 PlotRange -> 1,
 PolarAxes -> True,
 BaseStyle -> {FontFamily -> "Arial", FontSize -> 12},
 PolarTicks -> {{0, Pi/4, Pi/2, (3 Pi)/4, Pi, (5 Pi)/4, (3 Pi)/2, 
  (7 Pi)/4}, {0, .2, .4, .6, .8, 1}},
 PolarGridLines -> {{0, Pi/2, Pi, 3 Pi/2}, {0.25, 0.5, 0.75, 1}}]

enter image description here

Does anyone know how to do this? Thanks in advance!

$\endgroup$
3
  • 3
    $\begingroup$ Possible duplicate of ListPolarPlot not showing full plot range even with PlotRange -> All $\endgroup$
    – shrx
    Commented Oct 30, 2015 at 13:58
  • $\begingroup$ Greetings Linde! To make the most of Mma.SE please take the tour now. Help us to help you, write an excellent question. Edit if improvable, show due diligence, give brief context, include minimum working examples of code and data in formatted form. As you receive give back, vote and answer questions, keep the site useful, be kind, correct mistakes and share what you have learned. $\endgroup$
    – rhermans
    Commented Oct 30, 2015 at 14:08
  • 1
    $\begingroup$ This is definitely not a duplicate of the question shrx picks it to be a duplicate of and there is no answer for this question there. $\endgroup$
    – m_goldberg
    Commented Oct 30, 2015 at 20:21

1 Answer 1

10
$\begingroup$

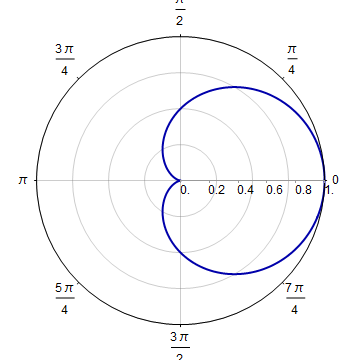
Use PolarAxesOrigin like this: PolarAxesOrigin -> {0, 1}

PolarPlot[
 Abs[1/2 (E^(I t) + 1)]^2, {t, 0, 2 π}
 , PlotStyle -> {Darker[Blue], Thick}
 , PlotRange -> 1.2
 , PolarAxesOrigin -> {0, 1}
 , PolarAxes -> True
 , BaseStyle -> {FontFamily -> "Arial", FontSize -> 12}
 , PolarTicks -> {{0, Pi/4, Pi/2, (3 Pi)/4, 
    Pi, (5 Pi)/4, (3 Pi)/2, (7 Pi)/4}, {0, .2, .4, .6, .8, 1}}
 , PolarGridLines -> {{0, Pi/2, Pi, 3 Pi/2}, {0.25, 0.5, 0.75, 1}}
 ]

Mathematica graphics

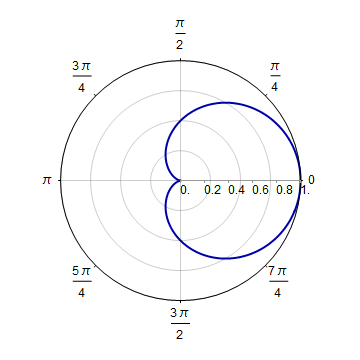
Or for a better fit

PolarPlot[
 Abs[1/2 (E^(I t) + 1)]^2, {t, 0, 2 π}
 , PlotStyle -> {Darker[Blue], Thick}
 , PlotRange -> 1.2
 , PolarAxesOrigin -> {0, 1}
 , PolarAxes -> True
 , BaseStyle -> {FontFamily -> "Arial", FontSize -> 12}
 , PolarTicks -> {{0, Pi/4, Pi/2, (3 Pi)/4, 
    Pi, (5 Pi)/4, (3 Pi)/2, (7 Pi)/4}, {0, .2, .4, .6, .8, 1}}
 , PolarGridLines -> {{0, Pi/2, Pi, 3 Pi/2}, {0.25, 0.5, 0.75, 1}}
 ]

Mathematica graphics

$\endgroup$
1
  • $\begingroup$ Thanks! That's just what I needed :) $\endgroup$
    – Linde
    Commented Oct 30, 2015 at 14:05

Your Answer

By clicking “Post Your Answer”, you agree to our terms of service and acknowledge you have read our privacy policy.

Not the answer you're looking for? Browse other questions tagged or ask your own question.