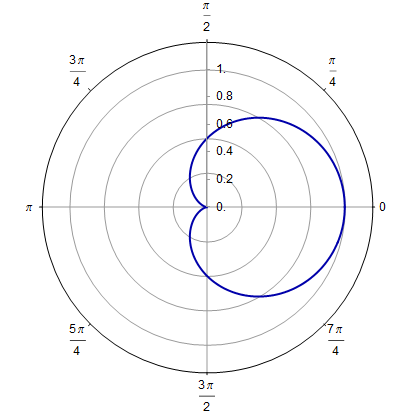
I'm trying to make a polar plot. The radial range (radius of the circle) is automatically set at 1.2. I want to change this to 1. My code is:

PolarPlot[Abs[1/2 (E^(I t) + 1)]^2, {t, 0, 2 \[Pi]π}, 
 PlotStyle -> {Darker[Blue], Thick},
 PolarAxes -> True,
 BaseStyle -> {FontFamily -> "Arial", FontSize -> 12},
 PolarTicks -> {{0, Pi/4, Pi/2, (3 Pi)/4, Pi, (5 Pi)/4, (3 Pi)/2, 
  (7 Pi)/4}, {0, .2, .4, .6, .8, 1}},
 PolarGridLines -> {{0, Pi/2, Pi, 3 Pi/2}, {0.25, 0.5, 0.75, 1}}]

enter image description here

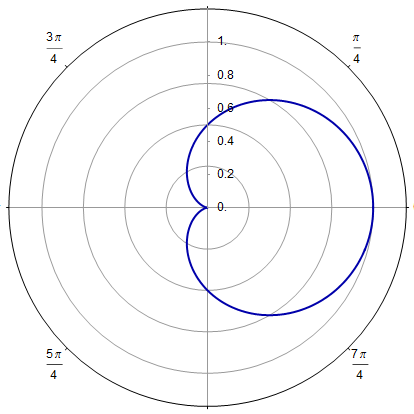
On the internet I found the command PlotRange -> 1, but this makes it even worse.

PolarPlot[Abs[1/2 (E^(I t) + 1)]^2, {t, 0, 2 \[Pi]π}, 
 PlotStyle -> {Darker[Blue], Thick},
 PlotRange -> 1,
 PolarAxes -> True,
 BaseStyle -> {FontFamily -> "Arial", FontSize -> 12},
 PolarTicks -> {{0, Pi/4, Pi/2, (3 Pi)/4, Pi, (5 Pi)/4, (3 Pi)/2, 
  (7 Pi)/4}, {0, .2, .4, .6, .8, 1}},
 PolarGridLines -> {{0, Pi/2, Pi, 3 Pi/2}, {0.25, 0.5, 0.75, 1}}]

enter image description here

Does anyone know how to do this? Thanks in advance!

I'm trying to make a polar plot. The radial range (radius of the circle) is automatically set at 1.2. I want to change this to 1. My code is:

PolarPlot[Abs[1/2 (E^(I t) + 1)]^2, {t, 0, 2 \[Pi]}, 
 PlotStyle -> {Darker[Blue], Thick},
 PolarAxes -> True,
 BaseStyle -> {FontFamily -> "Arial", FontSize -> 12},
 PolarTicks -> {{0, Pi/4, Pi/2, (3 Pi)/4, Pi, (5 Pi)/4, (3 Pi)/2, 
  (7 Pi)/4}, {0, .2, .4, .6, .8, 1}},
 PolarGridLines -> {{0, Pi/2, Pi, 3 Pi/2}, {0.25, 0.5, 0.75, 1}}]

enter image description here

On the internet I found the command PlotRange -> 1, but this makes it even worse.

PolarPlot[Abs[1/2 (E^(I t) + 1)]^2, {t, 0, 2 \[Pi]}, 
 PlotStyle -> {Darker[Blue], Thick},
 PlotRange -> 1,
 PolarAxes -> True,
 BaseStyle -> {FontFamily -> "Arial", FontSize -> 12},
 PolarTicks -> {{0, Pi/4, Pi/2, (3 Pi)/4, Pi, (5 Pi)/4, (3 Pi)/2, 
  (7 Pi)/4}, {0, .2, .4, .6, .8, 1}},
 PolarGridLines -> {{0, Pi/2, Pi, 3 Pi/2}, {0.25, 0.5, 0.75, 1}}]

enter image description here

Does anyone know how to do this? Thanks in advance!
I'm trying to make a polar plot. The radial range (radius of the circle) is automatically set at 1.2. I want to change this to 1. My code is:

PolarPlot[Abs[1/2 (E^(I t) + 1)]^2, {t, 0, 2 π}, 
 PlotStyle -> {Darker[Blue], Thick},
 PolarAxes -> True,
 BaseStyle -> {FontFamily -> "Arial", FontSize -> 12},
 PolarTicks -> {{0, Pi/4, Pi/2, (3 Pi)/4, Pi, (5 Pi)/4, (3 Pi)/2, 
  (7 Pi)/4}, {0, .2, .4, .6, .8, 1}},
 PolarGridLines -> {{0, Pi/2, Pi, 3 Pi/2}, {0.25, 0.5, 0.75, 1}}]

enter image description here

On the internet I found the command PlotRange -> 1, but this makes it even worse.

PolarPlot[Abs[1/2 (E^(I t) + 1)]^2, {t, 0, 2 π}, 
 PlotStyle -> {Darker[Blue], Thick},
 PlotRange -> 1,
 PolarAxes -> True,
 BaseStyle -> {FontFamily -> "Arial", FontSize -> 12},
 PolarTicks -> {{0, Pi/4, Pi/2, (3 Pi)/4, Pi, (5 Pi)/4, (3 Pi)/2, 
  (7 Pi)/4}, {0, .2, .4, .6, .8, 1}},
 PolarGridLines -> {{0, Pi/2, Pi, 3 Pi/2}, {0.25, 0.5, 0.75, 1}}]

enter image description here

Does anyone know how to do this? Thanks in advance!
added 15 characters in body
Source Link
Karsten7
  • 27.6k
  • 5
  • 74
  • 135

I'm trying to make a polar plot. The radial range (radius of the circle) is automatically set at 1.2. I want to change this to 1. My code is:

PolarPlot[Abs[1/2 (E^(I t) + 1)]^2, {t, 0, 2 \[Pi]}, 
 PlotStyle -> {Darker[Blue], Thick},
 PolarAxes -> True,
 BaseStyle -> {FontFamily -> "Arial", FontSize -> 12},
 PolarTicks -> {{0, Pi/4, Pi/2, (3 Pi)/4, Pi, (5 Pi)/4, (3 Pi)/2, (
  (7 Pi)/4}, {0, .2, .4, .6, .8, 1}},
 PolarGridLines -> {{0, Pi/2, Pi, 3 Pi/2}, {0.25, 0.5, 0.75, 1}}]

enter image description here

On the internet I found the command "PlotRange -> 1"PlotRange -> 1, but this makes it even worse.

PolarPlot[Abs[1/2 (E^(I t) + 1)]^2, {t, 0, 2 \[Pi]}, 
 PlotStyle -> {Darker[Blue], Thick},
 PlotRange -> 1,
 PolarAxes -> True,
 BaseStyle -> {FontFamily -> "Arial", FontSize -> 12},
 PolarTicks -> {{0, Pi/4, Pi/2, (3 Pi)/4, Pi, (5 Pi)/4, (3 Pi)/2, (
  (7 Pi)/4}, {0, .2, .4, .6, .8, 1}},
 PolarGridLines -> {{0, Pi/2, Pi, 3 Pi/2}, {0.25, 0.5, 0.75, 1}}]

enter image description here

Does anyone know how to do this? Thanks in advance!

I'm trying to make a polar plot. The radial range (radius of the circle) is automatically set at 1.2. I want to change this to 1. My code is:

PolarPlot[Abs[1/2 (E^(I t) + 1)]^2, {t, 0, 2 \[Pi]}, 
PlotStyle -> {Darker[Blue], Thick},
PolarAxes -> True,
BaseStyle -> {FontFamily -> "Arial", FontSize -> 12},
PolarTicks -> {{0, Pi/4, Pi/2, (3 Pi)/4, Pi, (5 Pi)/4, (3 Pi)/2, (
7 Pi)/4}, {0, .2, .4, .6, .8, 1}},
PolarGridLines -> {{0, Pi/2, Pi, 3 Pi/2}, {0.25, 0.5, 0.75, 1}}]

enter image description here

On the internet I found the command "PlotRange -> 1", but this makes it even worse.

PolarPlot[Abs[1/2 (E^(I t) + 1)]^2, {t, 0, 2 \[Pi]}, 
PlotStyle -> {Darker[Blue], Thick},
PlotRange -> 1,
PolarAxes -> True,
BaseStyle -> {FontFamily -> "Arial", FontSize -> 12},
PolarTicks -> {{0, Pi/4, Pi/2, (3 Pi)/4, Pi, (5 Pi)/4, (3 Pi)/2, (
7 Pi)/4}, {0, .2, .4, .6, .8, 1}},
PolarGridLines -> {{0, Pi/2, Pi, 3 Pi/2}, {0.25, 0.5, 0.75, 1}}]

enter image description here

Does anyone know how to do this? Thanks in advance!

I'm trying to make a polar plot. The radial range (radius of the circle) is automatically set at 1.2. I want to change this to 1. My code is:

PolarPlot[Abs[1/2 (E^(I t) + 1)]^2, {t, 0, 2 \[Pi]}, 
 PlotStyle -> {Darker[Blue], Thick},
 PolarAxes -> True,
 BaseStyle -> {FontFamily -> "Arial", FontSize -> 12},
 PolarTicks -> {{0, Pi/4, Pi/2, (3 Pi)/4, Pi, (5 Pi)/4, (3 Pi)/2, 
  (7 Pi)/4}, {0, .2, .4, .6, .8, 1}},
 PolarGridLines -> {{0, Pi/2, Pi, 3 Pi/2}, {0.25, 0.5, 0.75, 1}}]

enter image description here

On the internet I found the command PlotRange -> 1, but this makes it even worse.

PolarPlot[Abs[1/2 (E^(I t) + 1)]^2, {t, 0, 2 \[Pi]}, 
 PlotStyle -> {Darker[Blue], Thick},
 PlotRange -> 1,
 PolarAxes -> True,
 BaseStyle -> {FontFamily -> "Arial", FontSize -> 12},
 PolarTicks -> {{0, Pi/4, Pi/2, (3 Pi)/4, Pi, (5 Pi)/4, (3 Pi)/2, 
  (7 Pi)/4}, {0, .2, .4, .6, .8, 1}},
 PolarGridLines -> {{0, Pi/2, Pi, 3 Pi/2}, {0.25, 0.5, 0.75, 1}}]

enter image description here

Does anyone know how to do this? Thanks in advance!

Source Link
Linde
  • 61
  • 2

Radial range in polar plot

I'm trying to make a polar plot. The radial range (radius of the circle) is automatically set at 1.2. I want to change this to 1. My code is:

PolarPlot[Abs[1/2 (E^(I t) + 1)]^2, {t, 0, 2 \[Pi]}, 
PlotStyle -> {Darker[Blue], Thick},
PolarAxes -> True,
BaseStyle -> {FontFamily -> "Arial", FontSize -> 12},
PolarTicks -> {{0, Pi/4, Pi/2, (3 Pi)/4, Pi, (5 Pi)/4, (3 Pi)/2, (
7 Pi)/4}, {0, .2, .4, .6, .8, 1}},
PolarGridLines -> {{0, Pi/2, Pi, 3 Pi/2}, {0.25, 0.5, 0.75, 1}}]

enter image description here

On the internet I found the command "PlotRange -> 1", but this makes it even worse.

PolarPlot[Abs[1/2 (E^(I t) + 1)]^2, {t, 0, 2 \[Pi]}, 
PlotStyle -> {Darker[Blue], Thick},
PlotRange -> 1,
PolarAxes -> True,
BaseStyle -> {FontFamily -> "Arial", FontSize -> 12},
PolarTicks -> {{0, Pi/4, Pi/2, (3 Pi)/4, Pi, (5 Pi)/4, (3 Pi)/2, (
7 Pi)/4}, {0, .2, .4, .6, .8, 1}},
PolarGridLines -> {{0, Pi/2, Pi, 3 Pi/2}, {0.25, 0.5, 0.75, 1}}]

enter image description here

Does anyone know how to do this? Thanks in advance!