added 8 characters in body
Source Link
m_goldberg
  • 108.1k
  • 16
  • 104
  • 259

My experience with Mathematica tells me to solve the problem by trimming the data before plotting it, rather than plotting all the data but then restricting the viewport. One way to do it is

data = Table[{i, Sin @ i}, {i, -50, 50}];
ListLinePlot[Labeled[Select[data, 20 <= First[#] <= 50 &], "data"], FramePlotTheme -> True]"Frame"]

But it might even be easier to just generate a new data set.

trimedData = Table[{i, Sin @ i}, {i, 20, 50}];
ListLinePlot[Labeled[trimedData, "data"], FramePlotTheme -> True]"Frame"]

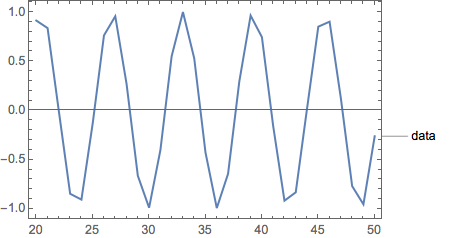
Both plots are same.

plotplot

My experience with Mathematica tells me to solve the problem by trimming the data before plotting it, rather than plotting all the data but then restricting the viewport. One way to do it is

data = Table[{i, Sin @ i}, {i, -50, 50}];
ListLinePlot[Labeled[Select[data, 20 <= First[#] <= 50 &], "data"], Frame -> True]

But it might even be easier to just generate a new data set.

trimedData = Table[{i, Sin @ i}, {i, 20, 50}];
ListLinePlot[Labeled[trimedData, "data"], Frame -> True]

Both plots are same.

plot

My experience with Mathematica tells me to solve the problem by trimming the data before plotting it, rather than plotting all the data but then restricting the viewport. One way to do it is

data = Table[{i, Sin @ i}, {i, -50, 50}];
ListLinePlot[Labeled[Select[data, 20 <= First[#] <= 50 &], "data"], PlotTheme -> "Frame"]

But it might even be easier to just generate a new data set.

trimedData = Table[{i, Sin @ i}, {i, 20, 50}];
ListLinePlot[Labeled[trimedData, "data"], PlotTheme -> "Frame"]

Both plots are same.

plot

Source Link
m_goldberg
  • 108.1k
  • 16
  • 104
  • 259

My experience with Mathematica tells me to solve the problem by trimming the data before plotting it, rather than plotting all the data but then restricting the viewport. One way to do it is

data = Table[{i, Sin @ i}, {i, -50, 50}];
ListLinePlot[Labeled[Select[data, 20 <= First[#] <= 50 &], "data"], Frame -> True]

But it might even be easier to just generate a new data set.

trimedData = Table[{i, Sin @ i}, {i, 20, 50}];
ListLinePlot[Labeled[trimedData, "data"], Frame -> True]

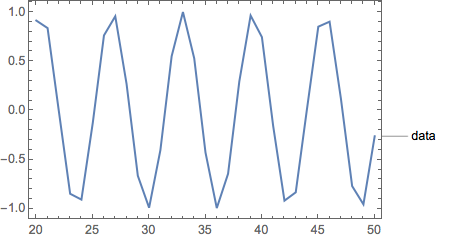
Both plots are same.

plot