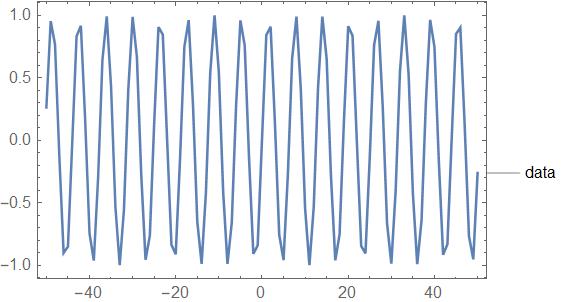
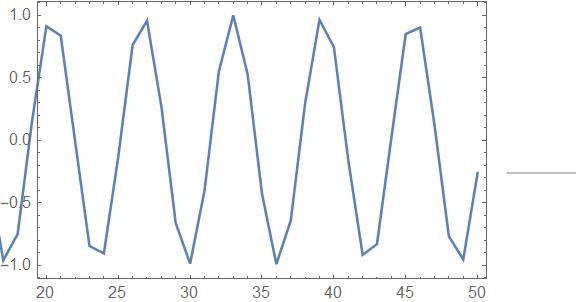
I am having problems with the new labeling functions Labeled when used in ListPlot or any of its sibblings. Labeled data can only be shown with the full range. If I apply a partial PlotRange the plots is messed up:
data = Table[{i, Sin@i}, {i, -50, 50}];

ListLinePlot[Labeled[data, "data"], PlotTheme -> "Frame"]
ListLinePlot[Labeled[data, "data"], PlotRange -> {{20, 50}, All}, PlotTheme -> "Frame"]
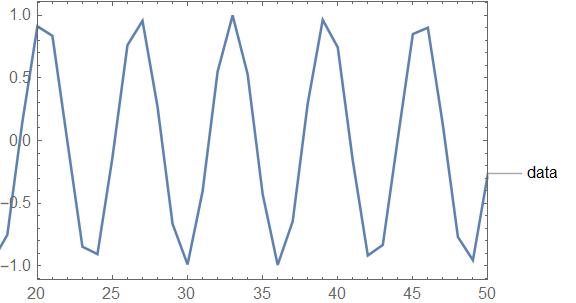
Show doesn't help, as it sometimes does in similar cases. It just adds to the mess:
Show[ListLinePlot[Labeled[data, "data"]], PlotRange -> {{20, 50}, All}]
Consistently, the behavior is the same when using Callout instead:
Of course I copuld pre-filter my data, but the whole point of PlotRange is not having to do it. I assume this is a bug. Does anybody know of an easy workaround?
Edit:
This is on Windows 10, Version 11.2


