3
$\begingroup$

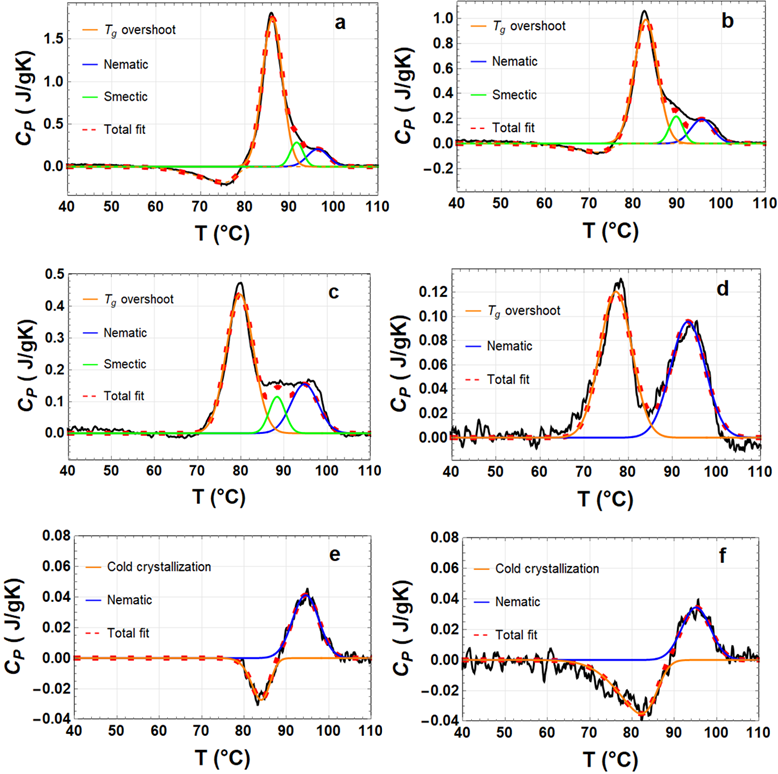
I have plots of 6 different figures in a command decon so that if I use decon[[1]] I plot the first figure and if I use decon[[2]] I plot the second figure and so on. The decon storage of the figures was obtained using the command AppendTo. The figures look like this after I manually plot each of them in two different rows:

enter image description here

Question:

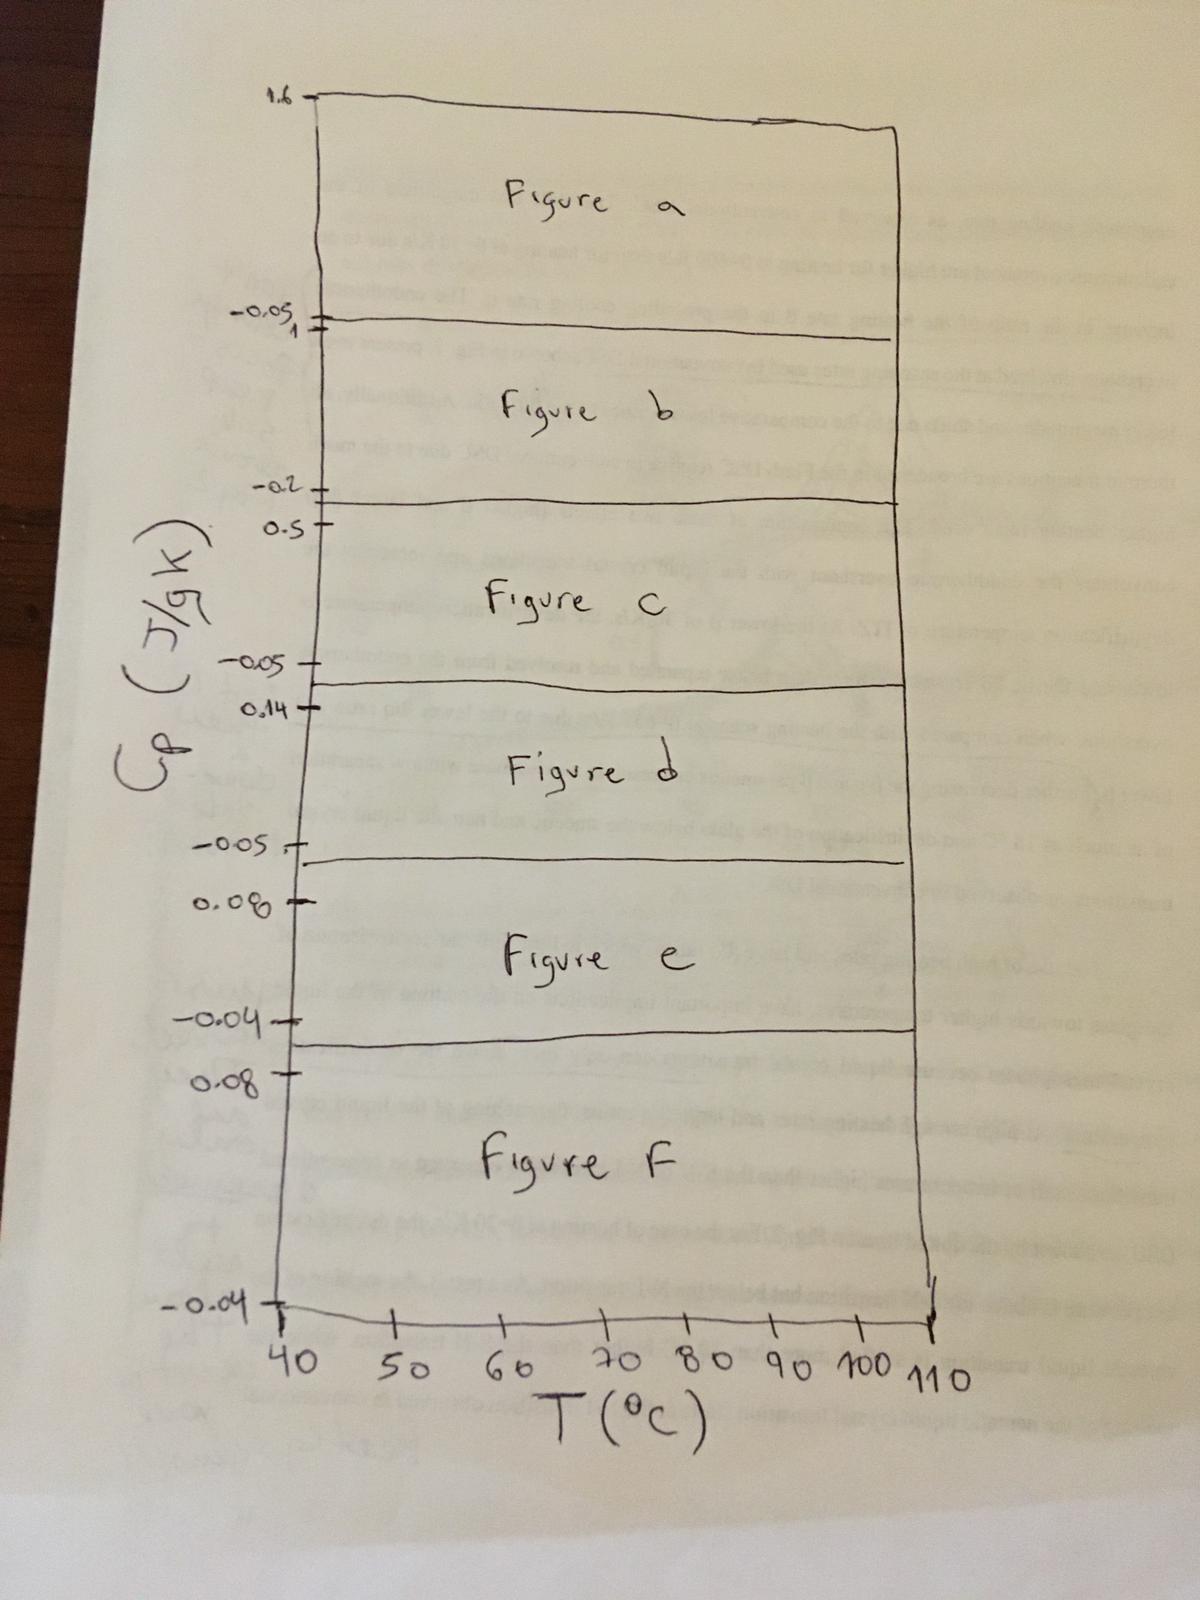
How can I plot these figures as a one column panel where they share the same x axis (T in celsius) from 40 to 110 and the same y axis (Cp in J/gK) but the y-axis changes for each figure each time, similar to the manual sketch I did below:

enter image description here

Thank you in advanced for your help.

EDIT AND UPDATE

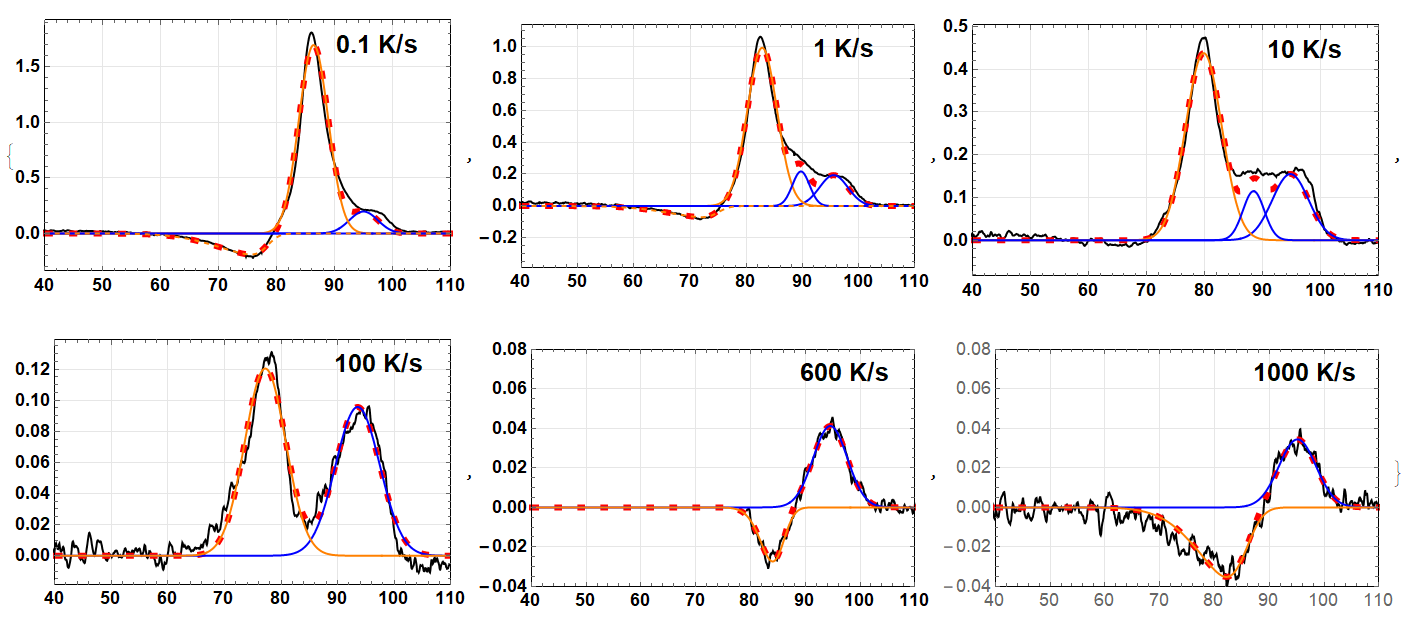
The result of the code done by @MassDefect is exactly what I want. The problem is that it doesn't work in my case because in his code decon is generating the ListPlot in a certain way. In my case I already have decon generated. When I put decon I get the following (I just changed a,b,c,d,e,f for something else but it is the same):

enter image description here

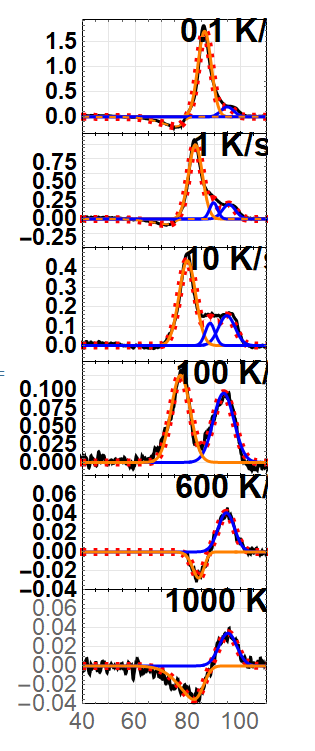
If I put pg[Transpose[{decon}]] I get my figures like this:

enter image description here

How can I modify the code so that when I do pg[Transpose[{decon}]] in my case it works?

$\endgroup$
3
  • $\begingroup$ How do you generate the figures in the first place? Currently, decon is a list that stores the full graphics objects, which includes things like the x axis labels. I'm thinking it might be easier to alter the original plotting commands than to strip these parts off of the already-generated graphics objects, but I want to know what you're working with first! $\endgroup$
    – thorimur
    Commented Nov 30, 2020 at 4:30
  • $\begingroup$ Also, just wondering: do you want the different figures to have the same vertical scale? That is, do you want a difference in 0.01 J/gK to correspond to the same vertical distance in figure a as figure e, even if the starting points are different? $\endgroup$
    – thorimur
    Commented Nov 30, 2020 at 4:35
  • $\begingroup$ @thorimur please see the update above that I believe answer your question. Thank you for your help. $\endgroup$
    – John
    Commented Dec 1, 2020 at 2:35

2 Answers 2

4
$\begingroup$

If I've understood, it seems like you just want a variation of the answer you received in Plot Figures in two columns.

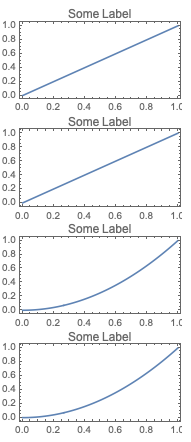
ResourceFunction["PlotGrid"][
 {
  {Plot[x, {x, 0, 1}, Frame -> True, 
    PlotLabel -> "Some Label"]}, {Plot[x, {x, 0, 1}, Frame -> True, 
    PlotLabel -> "Some Label"]}, {Plot[x^2, {x, 0, 1}, Frame -> True, 
    PlotLabel -> "Some Label"]}, {Plot[x^2, {x, 0, 1}, Frame -> True, 
    PlotLabel -> "Some Label"]}
  }, Spacings -> {0, 30}]

enter image description here

Essentially each grid row has a single element.

You can adjust Spacings to overlap Axes labels and show a single Axis on the bottom graph.


In response to comments...

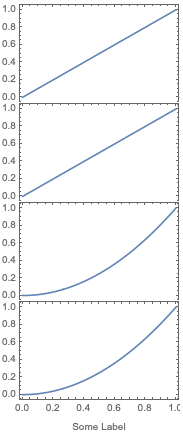
decon =
 {{Plot[x, {x, 0, 1}, Ticks -> {None, Automatic}, Frame -> {False, True, True, True}]},
  {Plot[x, {x, 0, 1}, Ticks -> {None, Automatic}, Frame -> {False, True, True, True}]},
  {Plot[x^2, {x, 0, 1}, Ticks -> {None, Automatic}, Frame -> {False, True, True, True}]},
  {Plot[x^2, {x, 0, 1}, Frame -> True, FrameLabel -> "Some Label"]}}

ResourceFunction["PlotGrid"][decon, Spacings -> {0, 2}]

enter image description here

You need to do some recasting of decon along the lines I have set out above. You could do some of this programmatically on the fly, but that gets more complicated.

$\endgroup$
1
  • $\begingroup$ Jagra! Thank you very much for your code. I wanted the figure a little bit closer to what @MassDefect did above. The problem I am still having is that the code as done doesn't still work for my case for what I mention in the update of my question. $\endgroup$
    – John
    Commented Dec 1, 2020 at 2:37
4
$\begingroup$

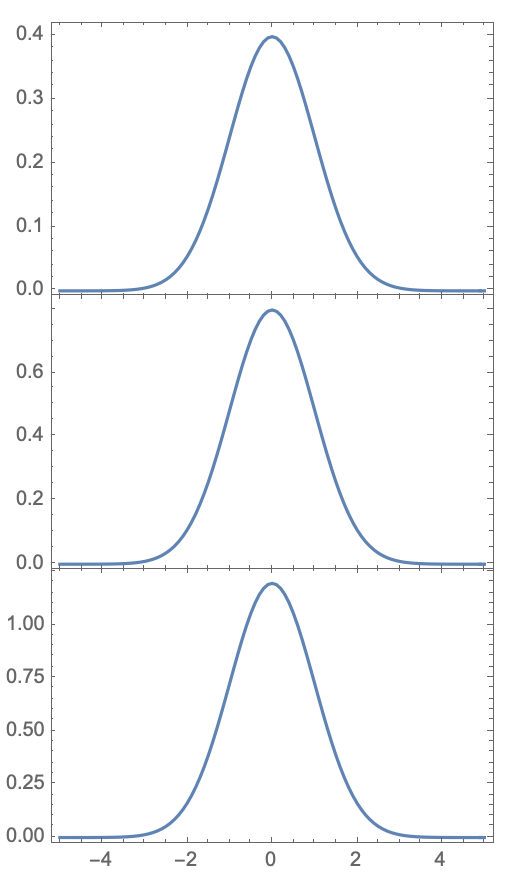
I think @Jagra has the right idea using PlotGrid. You can do it manually using Grid or GraphicsGrid as well, but you end up having to tweak quite a few parameters. If you want to get them to share an x-axis, you can change Jagra's answer like this:

pg = ResourceFunction["PlotGrid"];
data = Table[{x, i PDF[NormalDistribution[], x]}, {i, 3}, {x, -5, 5, 0.1}];
decon = ListLinePlot[#, Axes -> False, Frame -> True] & /@ data;
pg[Transpose[{decon}]]

PlotGrid

If you have all of your graphs stored in decon and it's a 1-D list, you should be able to do the same thing:

pg[Transpose[{decon}]]

EDIT:

It looks like the sizing on your graphs is off. Maybe something like

pg[
  Transpose[{decon}],
  FrameLabel -> {"x-axis", "y-axis"}
  ImageSize -> 500
]

will help? It's hard to say for certain without being able to try your code exactly. My decon is also generated in a "certain way", so I think they should be fairly similar in theory. If you just call decon by itself with my code, you'll see that there are three distinct plots.

You may also need to change some options in your plots when you generate decon such as the label size and things like that. It's also possible to post-process decon using functions that go through the code contained in decon and replacing elements, but I'm not very good at that and there's no example code here to really test it on.

$\endgroup$
3
  • $\begingroup$ MassDefect, thank you very much. It looks exactly like I wanted it!. One question: How can I put the labels in the x and y axis in the center of each axis? $\endgroup$
    – John
    Commented Nov 30, 2020 at 15:35
  • $\begingroup$ MassDefect, also can you look at the updated comments I did in my question?. Your code doesn't seem to be working in my case because my decon is already generated in a certain way. So I will just need to transpose it, but when I do it looks all very bad. Can you help me fix that? $\endgroup$
    – John
    Commented Nov 30, 2020 at 16:28
  • 1
    $\begingroup$ @John I've made an edit based on your comments. Hopefully it helps a little bit. $\endgroup$
    – MassDefect
    Commented Dec 1, 2020 at 19:04

Your Answer

By clicking “Post Your Answer”, you agree to our terms of service and acknowledge you have read our privacy policy.

Not the answer you're looking for? Browse other questions tagged or ask your own question.