responses to comments
Source Link
Jagra
  • 14.6k
  • 1
  • 39
  • 82

If I've understood, it seems like you just want a variation of the answer you received in Plot Figures in two columns.

ResourceFunction["PlotGrid"][
 {
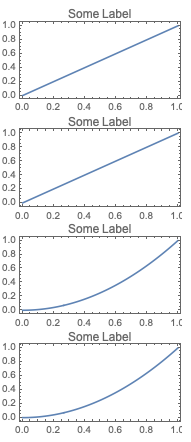
  {Plot[x, {x, 0, 1}, Frame -> True, 
    PlotLabel -> "Some Label"]}, {Plot[x, {x, 0, 1}, Frame -> True, 
    PlotLabel -> "Some Label"]}, {Plot[x^2, {x, 0, 1}, Frame -> True, 
    PlotLabel -> "Some Label"]}, {Plot[x^2, {x, 0, 1}, Frame -> True, 
    PlotLabel -> "Some Label"]}
  }, Spacings -> {0, 30}]

enter image description here

Essentially each grid row has a single element.

You can adjust Spacings to overlap Axes labels and show a single Axis on the bottom graph.


In response to comments...

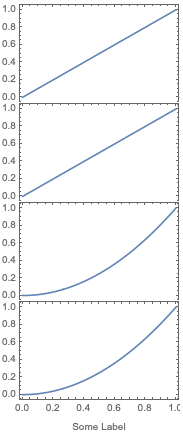
decon =
 {{Plot[x, {x, 0, 1}, Ticks -> {None, Automatic}, Frame -> {False, True, True, True}]},
  {Plot[x, {x, 0, 1}, Ticks -> {None, Automatic}, Frame -> {False, True, True, True}]},
  {Plot[x^2, {x, 0, 1}, Ticks -> {None, Automatic}, Frame -> {False, True, True, True}]},
  {Plot[x^2, {x, 0, 1}, Frame -> True, FrameLabel -> "Some Label"]}}

ResourceFunction["PlotGrid"][decon, Spacings -> {0, 2}]

enter image description here

You need to do some recasting of decon along the lines I have set out above. You could do some of this programmatically on the fly, but that gets more complicated.

If I've understood, it seems like you just want a variation of the answer you received in Plot Figures in two columns.

ResourceFunction["PlotGrid"][
 {
  {Plot[x, {x, 0, 1}, Frame -> True, 
    PlotLabel -> "Some Label"]}, {Plot[x, {x, 0, 1}, Frame -> True, 
    PlotLabel -> "Some Label"]}, {Plot[x^2, {x, 0, 1}, Frame -> True, 
    PlotLabel -> "Some Label"]}, {Plot[x^2, {x, 0, 1}, Frame -> True, 
    PlotLabel -> "Some Label"]}
  }, Spacings -> {0, 30}]

enter image description here

Essentially each grid row has a single element.

You can adjust Spacings to overlap Axes labels and show a single Axis on the bottom graph.


In response to comments...

decon =
 {{Plot[x, {x, 0, 1}, Ticks -> {None, Automatic}, Frame -> {False, True, True, True}]},
  {Plot[x, {x, 0, 1}, Ticks -> {None, Automatic}, Frame -> {False, True, True, True}]},
  {Plot[x^2, {x, 0, 1}, Ticks -> {None, Automatic}, Frame -> {False, True, True, True}]},
  {Plot[x^2, {x, 0, 1}, Frame -> True, FrameLabel -> "Some Label"]}}

ResourceFunction["PlotGrid"][decon, Spacings -> {0, 2}]

enter image description here

You need to do some recasting of decon along the lines I have set out above. You could do some of this programmatically on the fly, but that gets more complicated.
Source Link
Jagra
  • 14.6k
  • 1
  • 39
  • 82

If I've understood, it seems like you just want a variation of the answer you received in Plot Figures in two columns.

ResourceFunction["PlotGrid"][
 {
  {Plot[x, {x, 0, 1}, Frame -> True, 
    PlotLabel -> "Some Label"]}, {Plot[x, {x, 0, 1}, Frame -> True, 
    PlotLabel -> "Some Label"]}, {Plot[x^2, {x, 0, 1}, Frame -> True, 
    PlotLabel -> "Some Label"]}, {Plot[x^2, {x, 0, 1}, Frame -> True, 
    PlotLabel -> "Some Label"]}
  }, Spacings -> {0, 30}]

enter image description here

Essentially each grid row has a single element.

You can adjust Spacings to overlap Axes labels and show a single Axis on the bottom graph.