6
$\begingroup$

I´m curious if is it possible to plot in:

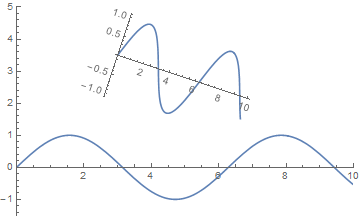
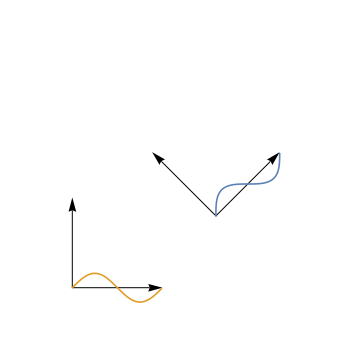
A. two different Cartesian coordinate system who share the same plane but have different origins and rotation. The visualization should preferably resemble the output of the Plot function, but with two sets of axis.

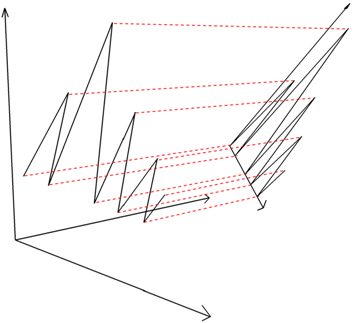
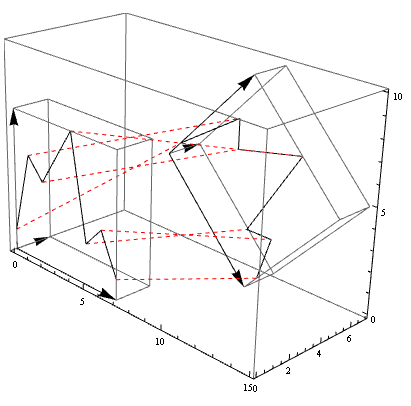
B. as A. but the systems don't share the same plane and with the axis projected as in Plot3D.

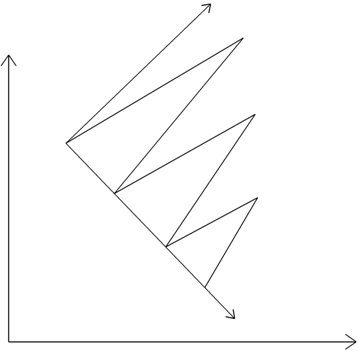
This sketch shows an idea of what A would look like, though in a simplified way:

enter image description here


This sketch gives a 3D perspective view of an example of B:
enter image description here

The aim is to help visualizing the projection of a function, path or list from one coordinate system to another (parent) system. I am not familiar with the mathematical concepts dealing with projections, so being able to plot would be a great start.

$\endgroup$
1
  • 1
    $\begingroup$ The drawings are added. $\endgroup$
    – MathLind
    Commented Apr 22, 2015 at 10:14

3 Answers 3

8
$\begingroup$

Update:

ClearAll[showF]
showF[tr_: {10, 10}, rt_: {-Pi/4, {0, 0}}, 
    opts : OptionsPattern[{Graphics, Graphics3D}]][g_] := 
 Module[{head = Head[g], pr = PlotRange[g],
   transF=Composition[TranslationTransform[tr], RotationTransform[rt[[1]], rt[[2]]]]}, 
  Module[{prim = If[head === Graphics3D, Cuboid, Rectangle] @@Transpose[pr],
    points = Cases[Normal@g, (Line | Point | Tube)[x_, ___] :> x, Infinity][[1]],
    axes = Thread[{#, {##2}}, List, {2}] & @@ 
        Nearest[#, #[[1]], If[head === Graphics3D, 4, 3]] &@Tuples[pr], gr2}, 
   gr2 = {g[[1]], EdgeForm[Directive[GrayLevel[.4], AbsoluteThickness[.02]]], 
     FaceForm[], prim, Arrow /@ axes};
   head[{gr2, GeometricTransformation[gr2, transF], Red, Dashed, 
     Line /@ Transpose[{points, transF /@ points}]}, opts]]]

Examples:

gr = Graphics[{Line[{{0, 1}, {1, 5}, {2, 4}, {4, 7}, {5, 2}, {6, 3}, {7, 1}}]}, 
    PlotRange -> {{0, 7}, {0, 7}}]; 
llp = ListLinePlot[{{0, 1}, {1, 5}, {2, 4}, {4, 7}, {5, 2}, {6, 3}, {7,  1}}, 
    BaseStyle -> Thick, PlotRangePadding -> 0];
lp = ListPlot[RandomReal[3, 10], PlotStyle -> Directive[PointSize[.03], Orange]];

Row[showF[{10, 10}, {-Pi/4, {0, 0}}, Axes -> True, ImageSize -> 300] /@ {gr, llp, lp}]

enter image description here

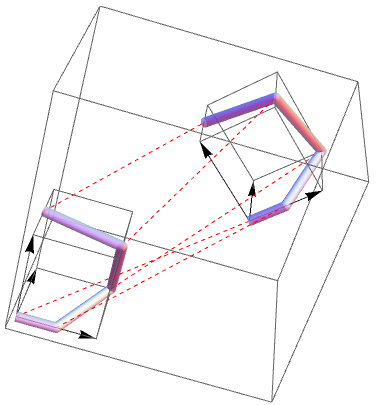
grb = Graphics3D[Cases[gr,
   Line[x_, ___] :> Line[Insert[#, #2, 2] & @@@ Thread[{x, 0}]], Infinity],
  ImageSize -> 400, PlotRange -> {{0, 7}, {0, 2}, {0, 7}}]; 

showF[{5, 5, 5}, {Pi/4, {0, 1, 0}}, Axes -> True, ImageSize -> 400]@grb
enter image description here

tubes = Graphics3D[{Opacity[.7], CapForm["Butt"], 
   Tube[{{1, 1, 0}, {3, 1, 0}, {5, 5, 0}, {5, 2, 5}, {1, 3, 5}}, .25]}]; 

showF[{10, 5, 5}, {-Pi/4, {0, 1, 0}}]@tubes
enter image description here


Original post:

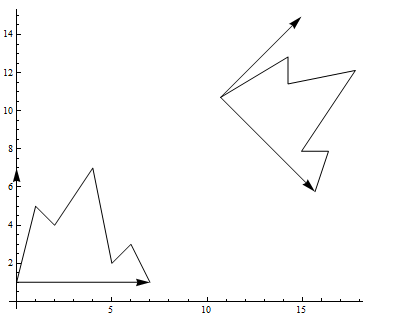
gr = Graphics[{Line[{{0, 1}, {1, 5}, {2, 4}, {4, 7}, {5, 2}, {6, 3}, {7, 1}}]}]; 

Graphics[{gr2 = Graphics[{Arrow[{{0, 1}, #}] & /@ ({#, Reverse@#2} & @@ 
                 PlotRange[gr]), gr[[1]]}][[1]], 
  GeometricTransformation[GeometricTransformation[gr2, RotationTransform[-45 Degree]],
   TranslationTransform[{10, 10}]]}, Axes -> True, 
 AxesOrigin -> {0, 0}]
enter image description here

Alternatively, define a function that does the required transformations given a graphics object as input:

ClearAll[gtF, showF]
gtF[tr_: {10, 10}, rt_: - Pi/4] := With[{transF = 
   Composition[TranslationTransform[tr], RotationTransform[rt]]}, 
   GeometricTransformation[#, transF]] &;

showF[tr_: {10, 10}, rt_: - Pi/4, opts : OptionsPattern[Graphics]] := 
  With[{gr2 = Graphics[{Arrow /@ ({{#, #2}, {#, #3}} & @@ 
            Tuples[PlotRange@#]), #[[1]]}][[1]]},
    Graphics[{gr2, gtF[tr, rt]@gr2}, opts]] &;

llp = ListLinePlot[{{0, 1}, {1, 5}, {2, 4}, {4, 7}, {5, 2}, {6, 3}, {7, 1}},
        BaseStyle -> Thick];
Row[showF[{10, 10}, -Pi/4, Axes -> True, ImageSize -> 300] /@ 
        {gr, llp, ListPlot[RandomReal[1, 20]]}]

enter image description here

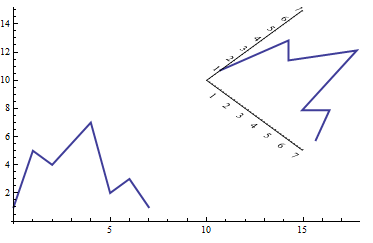
Note: You can also use the function gtF with MapAt as follows:

Show[llp, MapAt[gtF[], FullGraphics@llp, {1}], PlotRange -> All]
enter image description here

$\endgroup$
8
  • $\begingroup$ Thanks for a very meaty answer. Your first code snippet works. The second and third seems to ask for llp. Have I missed something ? $\endgroup$
    – MathLind
    Commented Apr 22, 2015 at 18:27
  • $\begingroup$ @MathLind, sorry i must have deleted it during the last update. I just added the missing line. $\endgroup$
    – kglr
    Commented Apr 22, 2015 at 18:34
  • $\begingroup$ From your third code snippet I get an error message containing multiple instances of "Axes::axes: "{{False,False},{False,False}} is not a valid axis specification. " and "Ticks::ticks: "{Automatic,Automatic} is not a valid tick specification." Any idea what is going on ? $\endgroup$
    – MathLind
    Commented Apr 23, 2015 at 19:37
  • $\begingroup$ @MathLind, It could be version/os difference; it is working as expected in version 9.0.1.0 (windows 8 64-bit), I haven't test it on version 10. I will post a version that doesn't depend on the function boxF later. $\endgroup$
    – kglr
    Commented Apr 23, 2015 at 19:50
  • $\begingroup$ just to be sure... I am referring to the code snippet containing Show[llp, MapAt[gtF[], FullGraphics@llp, {1}], PlotRange -> All] $\endgroup$
    – MathLind
    Commented Apr 24, 2015 at 5:16
6
$\begingroup$

Here is an approach with Inset. From the documentation:

Inset[obj,pos,opos,size,dirs]
represents an object obj inset in a graphic...
specifies that the inset should be placed at position pos in the graphic...
aligns the inset so that position opos in the object lies at position pos in the enclosing graphic...
specifies the size of the inset in the coordinate system of the enclosing graphic...
specifies that the axes of the inset should be oriented in directions dirs.

Thus with this line of code

Plot[Sin[x], {x, 0, 10}, PlotRange -> {{0, 10}, {-1.5, 5}}, 
 Epilog -> 
  Inset[Plot[Sin[x], {x, 0, 10}], {3, 3.5}, {0, 0}, 5, {1, -1/3}]]

we get this plot:

enter image description here

$\endgroup$
2
  • $\begingroup$ I was about to post this too. +1 If the OP wishes to match the scale of the two plots see: (73522) $\endgroup$
    – Mr.Wizard
    Commented Apr 22, 2015 at 15:47
  • $\begingroup$ One brief comment that doesn't quite merit an edit. dirs with a list of two numbers specify the direction of the x-axis. I'll aim to edit my answer to meet the concept of Affine transformation (the concept, not the built-in function) tomorrow to cover the question "I have a given translation + rotation, what parameters I need to pass to Inset?". ps - upon writing, not so brief, after all. $\endgroup$
    – LLlAMnYP
    Commented Apr 22, 2015 at 20:18
3
$\begingroup$

Here is an example. You have to be careful with the plot range so that the aspect ratio is just right, otherwise the figure is going to look skewed.

transform = Composition[
   TranslationTransform[{10, 5}],
   RotationTransform[45 Degree]
   ];

ListLinePlot[{
  Table[transform@{x, Sin[x]}, {x, 0, 2 Pi, 0.1}],
  Table[{x, Sin[x]}, {x, 0, 2 Pi, 0.1}]
  },
 AspectRatio -> 1,
 PlotRange -> {{-5, 20}, {-5, 20}},
 Axes -> None,
 Prolog -> {
   Arrowheads[{-Automatic, Automatic}],
   Arrow[{{0, 2 Pi}, {0, 0}, {2 Pi, 0}}],
   Arrow[transform /@ {{0, 2 Pi}, {0, 0}, {2 Pi, 0}}]
   }]

Transformed functions

$\endgroup$

Your Answer

By clicking “Post Your Answer”, you agree to our terms of service and acknowledge you have read our privacy policy.

Not the answer you're looking for? Browse other questions tagged or ask your own question.