3
$\begingroup$

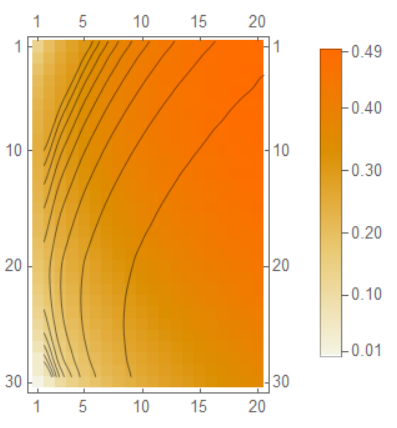
I'm currently doing some data analysis and I'm struggling to get ListContourPlot to work as expected. Here is a MatrixPlot of my data (just a list of lists):

enter image description here

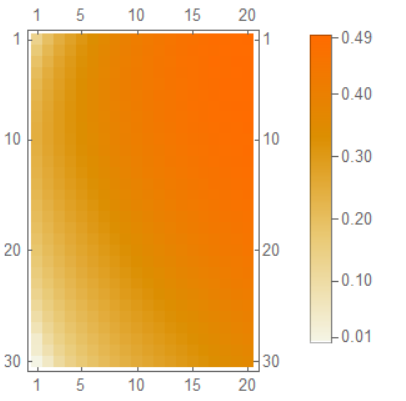
By eye it seems like adding contours to this plot shouldn't really pose much of a problem, but doing ListContourPlot on the same data and overlaying it over the MatrixPlot, I get the following:

enter image description here

Clearly the contours are not following lines of constant colour; can anyone give me any hints as to what might have gone wrong?

$\endgroup$

1 Answer 1

4
$\begingroup$

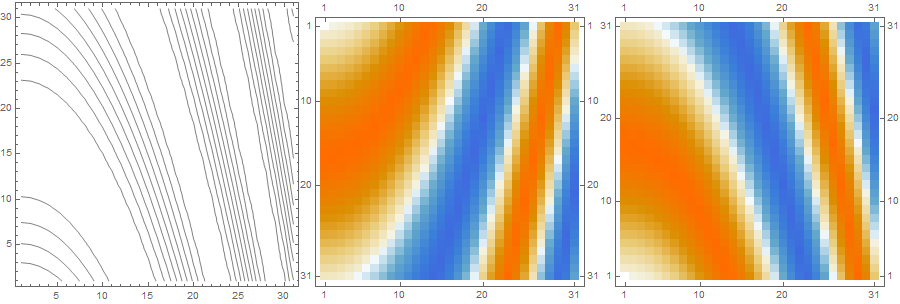
Add the option DataReversed -> True to MatrixPlot:

data = Table[Sin[i + j^2], {i, 0, 3, 0.1}, {j, 0, 3, 0.1}];

lcp = ListContourPlot[data, ImageSize -> 300, ContourShading -> None];
mp1 = MatrixPlot[data, ImageSize -> 300];
mp2 = MatrixPlot[data, ImageSize -> 300, DataReversed -> True];

Row[{lcp, mp1, mp2}]

enter image description here

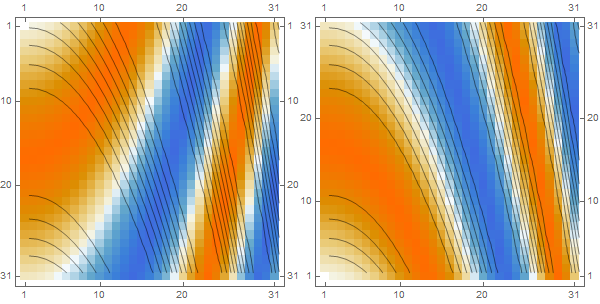
Row[Show[mp1, lcp], Show[mp2, lcp]]

enter image description here

$\endgroup$
3
  • $\begingroup$ Brilliant, thank you for the help! Is there any option to do the exact same operation to the ListContourPlot, so that I can keep the data ordered in the way it's ordered in the MatrixPlot? $\endgroup$
    – alex1stef2
    Commented Apr 2, 2020 at 14:58
  • $\begingroup$ @alex1stef2, my pleasure. Thank you for the accept. Welcome to mma.se. $\endgroup$
    – kglr
    Commented Apr 2, 2020 at 14:59
  • $\begingroup$ ... Re "same operation for ListContourPlot.." : you can reverse the rows of the input matrix: ListContourPlot[Reverse@data, ImageSize -> 300, ContourShading -> None] $\endgroup$
    – kglr
    Commented Apr 2, 2020 at 15:24

Your Answer

By clicking “Post Your Answer”, you agree to our terms of service and acknowledge you have read our privacy policy.

Not the answer you're looking for? Browse other questions tagged or ask your own question.