2
$\begingroup$

I would like to do a small demonstration of Monte Carlo integration. However, When I generated the plot code, it does not work properly.

mcPlot[nn_] := 
 Module[{x, y, n = nn, colorFunction}, 
  x = RandomReal[{0, π/2}, n]; y = N[Sin[x]]; 
  colorFunction = ColorData["BrightBands"]; 
  GraphicsGrid[{{Show[
      Plot[Sin[x], {x, 0, π/2}, Frame -> True, ImageSize -> Large,
        PlotStyle -> Thickness[0.01], 
       FrameLabel -> {{Text[
           Style["Sin[x]", Medium, Bold, RGBColor[0.2, 0.5, 0.9]]], 
          None}, {Text[
           Style["x ∈ [0, \!\(\*FractionBox[\(π\), \
\(2\)]\)]", Medium, Bold, RGBColor[0.2, 0.5, 0.9]]], None}}], 
      Graphics[{EdgeForm[
         Opacity[.5]], {colorFunction[#[[1]]/(π/2)], Opacity[.05],
            Rectangle[{0, 0}, {#[[1]], #[[2]]}], 
           colorFunction[#[[1]]/(π/2)], Opacity[.05], 
           Rectangle[{#[[1]], #[[2]]}, {π/2, 0}]} & /@ 
         Transpose[{x, y}], {PointSize[0.015], 
         Point[Transpose[{x, y}]]}}]], 
     GraphicsGrid[{{Text[
         Style["\!\(\*FractionBox[\(1\), \
\(n\)]\)\!\(\*UnderoverscriptBox[\(∑\), \(i = 1\), \
\(n\)]\)Sin[\!\(\*SubscriptBox[\(x\), \(i\)]\)] = ", Medium, Bold, 
          RGBColor[0.2, 0.2, 0.2]]], 
        Text[Style[Mean[y], Medium, Bold, 
          RGBColor[0.2, 0.2, 0.2]]]}, {Text[
         Style["\!\(\*FractionBox[\(\(|\)\(S\\\  - \*SubscriptBox[\(S\
\), \(0\)]\)\(|\)\), SubscriptBox[\(S\), \(0\)]]\) = ", Medium, Bold, 
          RGBColor[0.2, 0.2, 0.2]]], 
        Text[Style[Abs[Mean[y] π/2 - 1], Medium, Bold, 
          RGBColor[0.2, 0.2, 0.2]]]}}]}}]]
Manipulate[mcPlot[n], {n, 1, 10}]

1.It seems the problem is due to Random and text display.

2.The text on the right does not show up nicely and it is difficult to make them together in one frame.

Can any one help me with the issue.

$\endgroup$

1 Answer 1

2
$\begingroup$

Use

Manipulate[mcPlot[n], {n, 1, 10, 1}]

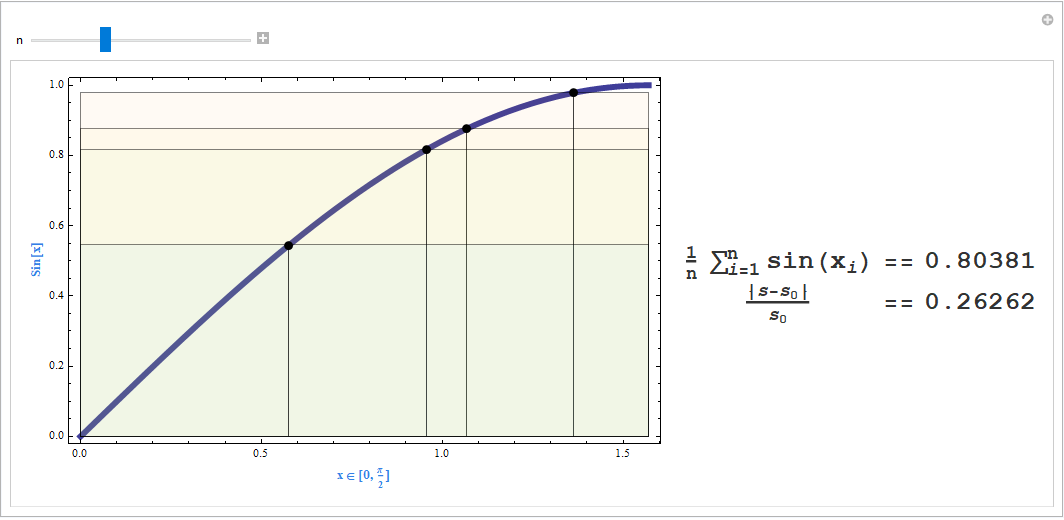
to avoid non-integer n being passed to RandomReal[{0, π/2}, n].

For the second part of the question, you can use Grid instead of GraphicsGrid:

ClearAll[mcPlot]
mcPlot[nn_] := Module[{x, y, n = nn, colorFunction}, 
  x = RandomReal[{0, π/2}, n]; y = N[Sin[x]];
  colorFunction = ColorData["BrightBands"];
  text = Grid[{{Style[TraditionalForm[
    HoldForm[Divide[1, "n"] Sum[Sin[Subscript["x", i]], {i, 1, "n"}]]], 
       Large, Bold, RGBColor[0.2, 0.2, 0.2]], 
   Style["==", Large, Bold, RGBColor[0.2, 0.2, 0.2]], 
   Style[Round[Mean[y], .00001], Large, Bold,  RGBColor[0.2, 0.2, 0.2]]}, 
  {Style[TraditionalForm[
    HoldForm[Divide[Abs[s - Subscript[s, 0]], Subscript[s, 0]]]], 
       Large, Bold, RGBColor[0.2, 0.2, 0.2]], 
   Style["==", Large, Bold, RGBColor[0.2, 0.2, 0.2]], 
   Style[Round[Abs[Mean[y] π/2 - 1], .00001], Large, Bold, RGBColor[0.2, 0.2, 0.2]]}}];
  Row[{Show[Plot[Sin[x], {x, 0, π/2}, Frame -> True, ImageSize -> Large, 
      PlotStyle -> Thickness[0.01], 
      FrameLabel -> {{Text[Style["Sin[x]", Medium, Bold, RGBColor[0.2, 0.5, 0.9]]], 
         None}, 
   {Text[ Style["x ∈ [0, \!\(\*FractionBox[\(π\), \\(2\)]\)]", 
   Medium, Bold, RGBColor[0.2, 0.5, 0.9]]], None}}], 
   Graphics[{EdgeForm[Opacity[.5]], {colorFunction[#[[1]]/(π/2)], 
     Opacity[.05], Rectangle[{0, 0}, {#[[1]], #[[2]]}], 
     colorFunction[#[[1]]/(π/2)], Opacity[.05], 
     Rectangle[{#[[1]], #[[2]]}, {π/2, 0}]} & /@ Transpose[{x, y}], 
     {PointSize[0.015], Point[Transpose[{x, y}]]}}]], text}, Spacer[10]]]
Manipulate[mcPlot[n], {n, 1, 10, 1}]

enter image description here

$\endgroup$

Your Answer

By clicking “Post Your Answer”, you agree to our terms of service and acknowledge you have read our privacy policy.

Not the answer you're looking for? Browse other questions tagged or ask your own question.