added 18 characters in body
Source Link
kglr
  • 400.5k
  • 18
  • 488
  • 929

Use

Manipulate[mcPlot[n], {n, 1, 10, 1}]

to avoid non-integer n being passed to RandomReal[{0, π/2}, n].

For the second part of the question, you can use Grid instead of GraphicsGrid:

ClearAll[mcPlot]
mcPlot[nn_] := Module[{x, y, n = nn, colorFunction}, 
  x = RandomReal[{0, π/2}, n]; y = N[Sin[x]];
  colorFunction = ColorData["BrightBands"];
  text = Grid[{{Style[TraditionalForm[
    HoldForm[Divide[1, "n"] Sum[Sin[Subscript["x", i]], {i, 1, "n"}]]], 
       Large, Bold, RGBColor[0.2, 0.2, 0.2]], 
   Style["==", Large, Bold, RGBColor[0.2, 0.2, 0.2]], 
   Style[N[Mean[y]Style[Round[Mean[y], 5].00001], Large, Bold,  RGBColor[0.2, 0.2, 0.2]]}, 
  {Style[TraditionalForm[
    HoldForm[Divide[Abs[s - Subscript[s, 0]], Subscript[s, 0]]]], 
       Large, Bold, RGBColor[0.2, 0.2, 0.2]], 
   Style["==", Large, Bold, RGBColor[0.2, 0.2, 0.2]], 
   Style[N[Abs[Mean[y]Style[Round[Abs[Mean[y] π/2 - 1], 5].00001], Large, Bold, RGBColor[0.2, 0.2, 0.2]]}}];
  Row[{Show[Plot[Sin[x], {x, 0, π/2}, Frame -> True, ImageSize -> Large, 
      PlotStyle -> Thickness[0.01], 
      FrameLabel -> {{Text[Style["Sin[x]", Medium, Bold, RGBColor[0.2, 0.5, 0.9]]], 
         None}, 
   {Text[ Style["x ∈ [0, \!\(\*FractionBox[\(π\), \\(2\)]\)]", 
   Medium, Bold, RGBColor[0.2, 0.5, 0.9]]], None}}], 
   Graphics[{EdgeForm[Opacity[.5]], {colorFunction[#[[1]]/(π/2)], 
     Opacity[.05], Rectangle[{0, 0}, {#[[1]], #[[2]]}], 
     colorFunction[#[[1]]/(π/2)], Opacity[.05], 
     Rectangle[{#[[1]], #[[2]]}, {π/2, 0}]} & /@ Transpose[{x, y}], 
     {PointSize[0.015], Point[Transpose[{x, y}]]}}]], text}, Spacer[10]]]
Manipulate[mcPlot[n], {n, 1, 10, 1}]

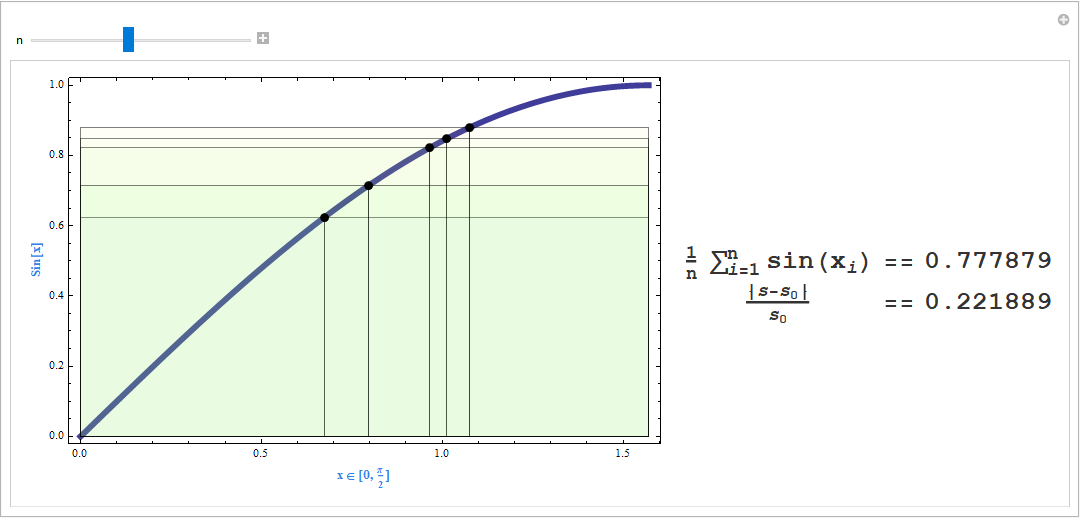
enter image description hereenter image description here

Use

Manipulate[mcPlot[n], {n, 1, 10, 1}]

to avoid non-integer n being passed to RandomReal[{0, π/2}, n].

For the second part of the question, you can use Grid instead of GraphicsGrid:

ClearAll[mcPlot]
mcPlot[nn_] := Module[{x, y, n = nn, colorFunction}, 
  x = RandomReal[{0, π/2}, n]; y = N[Sin[x]];
  colorFunction = ColorData["BrightBands"];
  text = Grid[{{Style[TraditionalForm[
    HoldForm[Divide[1, "n"] Sum[Sin[Subscript["x", i]], {i, 1, "n"}]]], 
       Large, Bold, RGBColor[0.2, 0.2, 0.2]], 
   Style["==", Large, Bold, RGBColor[0.2, 0.2, 0.2]], 
   Style[N[Mean[y], 5], Large, Bold,  RGBColor[0.2, 0.2, 0.2]]}, 
  {Style[TraditionalForm[
    HoldForm[Divide[Abs[s - Subscript[s, 0]], Subscript[s, 0]]]], 
       Large, Bold, RGBColor[0.2, 0.2, 0.2]], 
   Style["==", Large, Bold, RGBColor[0.2, 0.2, 0.2]], 
   Style[N[Abs[Mean[y] π/2 - 1], 5], Large, Bold, RGBColor[0.2, 0.2, 0.2]]}}];
  Row[{Show[Plot[Sin[x], {x, 0, π/2}, Frame -> True, ImageSize -> Large, 
      PlotStyle -> Thickness[0.01], 
      FrameLabel -> {{Text[Style["Sin[x]", Medium, Bold, RGBColor[0.2, 0.5, 0.9]]], 
         None}, 
   {Text[ Style["x ∈ [0, \!\(\*FractionBox[\(π\), \\(2\)]\)]", 
   Medium, Bold, RGBColor[0.2, 0.5, 0.9]]], None}}], 
   Graphics[{EdgeForm[Opacity[.5]], {colorFunction[#[[1]]/(π/2)], 
     Opacity[.05], Rectangle[{0, 0}, {#[[1]], #[[2]]}], 
     colorFunction[#[[1]]/(π/2)], Opacity[.05], 
     Rectangle[{#[[1]], #[[2]]}, {π/2, 0}]} & /@ Transpose[{x, y}], 
     {PointSize[0.015], Point[Transpose[{x, y}]]}}]], text}, Spacer[10]]]
Manipulate[mcPlot[n], {n, 1, 10, 1}]
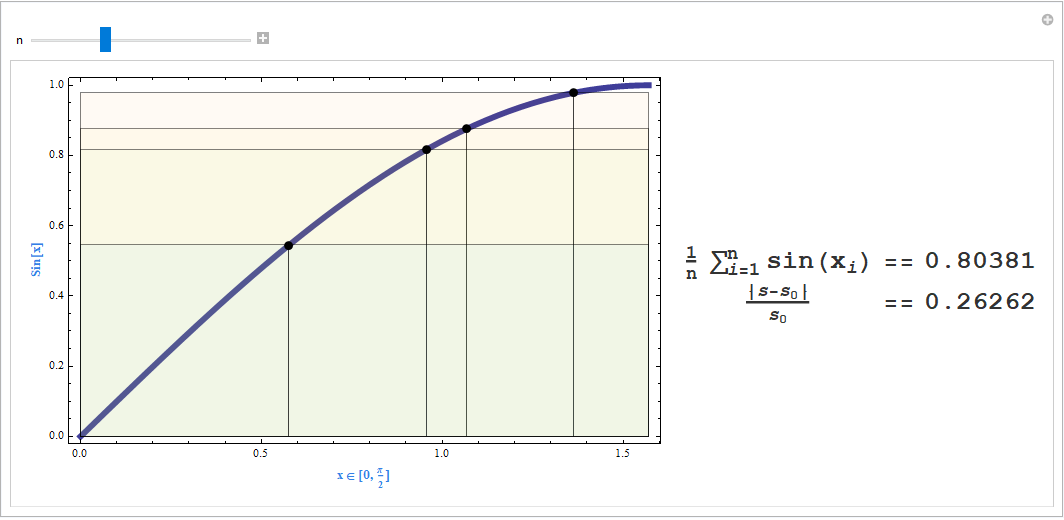
enter image description here

Use

Manipulate[mcPlot[n], {n, 1, 10, 1}]

to avoid non-integer n being passed to RandomReal[{0, π/2}, n].

For the second part of the question, you can use Grid instead of GraphicsGrid:

ClearAll[mcPlot]
mcPlot[nn_] := Module[{x, y, n = nn, colorFunction}, 
  x = RandomReal[{0, π/2}, n]; y = N[Sin[x]];
  colorFunction = ColorData["BrightBands"];
  text = Grid[{{Style[TraditionalForm[
    HoldForm[Divide[1, "n"] Sum[Sin[Subscript["x", i]], {i, 1, "n"}]]], 
       Large, Bold, RGBColor[0.2, 0.2, 0.2]], 
   Style["==", Large, Bold, RGBColor[0.2, 0.2, 0.2]], 
   Style[Round[Mean[y], .00001], Large, Bold,  RGBColor[0.2, 0.2, 0.2]]}, 
  {Style[TraditionalForm[
    HoldForm[Divide[Abs[s - Subscript[s, 0]], Subscript[s, 0]]]], 
       Large, Bold, RGBColor[0.2, 0.2, 0.2]], 
   Style["==", Large, Bold, RGBColor[0.2, 0.2, 0.2]], 
   Style[Round[Abs[Mean[y] π/2 - 1], .00001], Large, Bold, RGBColor[0.2, 0.2, 0.2]]}}];
  Row[{Show[Plot[Sin[x], {x, 0, π/2}, Frame -> True, ImageSize -> Large, 
      PlotStyle -> Thickness[0.01], 
      FrameLabel -> {{Text[Style["Sin[x]", Medium, Bold, RGBColor[0.2, 0.5, 0.9]]], 
         None}, 
   {Text[ Style["x ∈ [0, \!\(\*FractionBox[\(π\), \\(2\)]\)]", 
   Medium, Bold, RGBColor[0.2, 0.5, 0.9]]], None}}], 
   Graphics[{EdgeForm[Opacity[.5]], {colorFunction[#[[1]]/(π/2)], 
     Opacity[.05], Rectangle[{0, 0}, {#[[1]], #[[2]]}], 
     colorFunction[#[[1]]/(π/2)], Opacity[.05], 
     Rectangle[{#[[1]], #[[2]]}, {π/2, 0}]} & /@ Transpose[{x, y}], 
     {PointSize[0.015], Point[Transpose[{x, y}]]}}]], text}, Spacer[10]]]
Manipulate[mcPlot[n], {n, 1, 10, 1}]

enter image description here

added 1708 characters in body
Source Link
kglr
  • 400.5k
  • 18
  • 488
  • 929

Use

Manipulate[mcPlot[n], {n, 1, 10, 1}]

to avoid non-integer n being passed to RandomReal[{0, π/2}, n].

For the second part of the question, you can use Grid instead of GraphicsGrid:

ClearAll[mcPlot]
mcPlot[nn_] := Module[{x, y, n = nn, colorFunction}, 
  x = RandomReal[{0, π/2}, n]; y = N[Sin[x]];
  colorFunction = ColorData["BrightBands"];
  text = Grid[{{Style[TraditionalForm[
    HoldForm[Divide[1, "n"] Sum[Sin[Subscript["x", i]], {i, 1, "n"}]]], 
       Large, Bold, RGBColor[0.2, 0.2, 0.2]], 
   Style["==", Large, Bold, RGBColor[0.2, 0.2, 0.2]], 
   Style[N[Mean[y], 5], Large, Bold,  RGBColor[0.2, 0.2, 0.2]]}, 
  {Style[TraditionalForm[
    HoldForm[Divide[Abs[s - Subscript[s, 0]], Subscript[s, 0]]]], 
       Large, Bold, RGBColor[0.2, 0.2, 0.2]], 
   Style["==", Large, Bold, RGBColor[0.2, 0.2, 0.2]], 
   Style[N[Abs[Mean[y] π/2 - 1], 5], Large, Bold, RGBColor[0.2, 0.2, 0.2]]}}];
  Row[{Show[Plot[Sin[x], {x, 0, π/2}, Frame -> True, ImageSize -> Large, 
      PlotStyle -> Thickness[0.01], 
      FrameLabel -> {{Text[Style["Sin[x]", Medium, Bold, RGBColor[0.2, 0.5, 0.9]]], 
         None}, 
   {Text[ Style["x ∈ [0, \!\(\*FractionBox[\(π\), \\(2\)]\)]", 
   Medium, Bold, RGBColor[0.2, 0.5, 0.9]]], None}}], 
   Graphics[{EdgeForm[Opacity[.5]], {colorFunction[#[[1]]/(π/2)], 
     Opacity[.05], Rectangle[{0, 0}, {#[[1]], #[[2]]}], 
     colorFunction[#[[1]]/(π/2)], Opacity[.05], 
     Rectangle[{#[[1]], #[[2]]}, {π/2, 0}]} & /@ Transpose[{x, y}], 
     {PointSize[0.015], Point[Transpose[{x, y}]]}}]], text}, Spacer[10]]]
Manipulate[mcPlot[n], {n, 1, 10, 1}]

enter image description here

Use

Manipulate[mcPlot[n], {n, 1, 10, 1}]

to avoid non-integer n being passed to RandomReal[{0, π/2}, n].

Use

Manipulate[mcPlot[n], {n, 1, 10, 1}]

to avoid non-integer n being passed to RandomReal[{0, π/2}, n].

For the second part of the question, you can use Grid instead of GraphicsGrid:

ClearAll[mcPlot]
mcPlot[nn_] := Module[{x, y, n = nn, colorFunction}, 
  x = RandomReal[{0, π/2}, n]; y = N[Sin[x]];
  colorFunction = ColorData["BrightBands"];
  text = Grid[{{Style[TraditionalForm[
    HoldForm[Divide[1, "n"] Sum[Sin[Subscript["x", i]], {i, 1, "n"}]]], 
       Large, Bold, RGBColor[0.2, 0.2, 0.2]], 
   Style["==", Large, Bold, RGBColor[0.2, 0.2, 0.2]], 
   Style[N[Mean[y], 5], Large, Bold,  RGBColor[0.2, 0.2, 0.2]]}, 
  {Style[TraditionalForm[
    HoldForm[Divide[Abs[s - Subscript[s, 0]], Subscript[s, 0]]]], 
       Large, Bold, RGBColor[0.2, 0.2, 0.2]], 
   Style["==", Large, Bold, RGBColor[0.2, 0.2, 0.2]], 
   Style[N[Abs[Mean[y] π/2 - 1], 5], Large, Bold, RGBColor[0.2, 0.2, 0.2]]}}];
  Row[{Show[Plot[Sin[x], {x, 0, π/2}, Frame -> True, ImageSize -> Large, 
      PlotStyle -> Thickness[0.01], 
      FrameLabel -> {{Text[Style["Sin[x]", Medium, Bold, RGBColor[0.2, 0.5, 0.9]]], 
         None}, 
   {Text[ Style["x ∈ [0, \!\(\*FractionBox[\(π\), \\(2\)]\)]", 
   Medium, Bold, RGBColor[0.2, 0.5, 0.9]]], None}}], 
   Graphics[{EdgeForm[Opacity[.5]], {colorFunction[#[[1]]/(π/2)], 
     Opacity[.05], Rectangle[{0, 0}, {#[[1]], #[[2]]}], 
     colorFunction[#[[1]]/(π/2)], Opacity[.05], 
     Rectangle[{#[[1]], #[[2]]}, {π/2, 0}]} & /@ Transpose[{x, y}], 
     {PointSize[0.015], Point[Transpose[{x, y}]]}}]], text}, Spacer[10]]]
Manipulate[mcPlot[n], {n, 1, 10, 1}]

enter image description here

Source Link
kglr
  • 400.5k
  • 18
  • 488
  • 929

Use

Manipulate[mcPlot[n], {n, 1, 10, 1}]

to avoid non-integer n being passed to RandomReal[{0, π/2}, n].