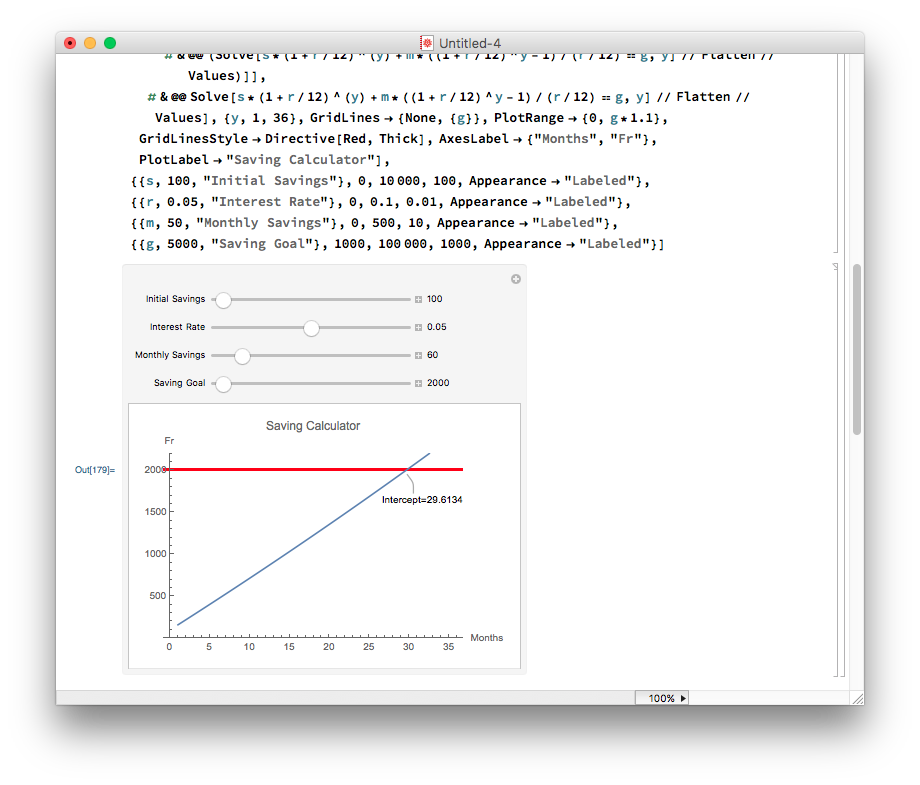
Should the intercept be shown on the plot?
    Manipulate[
 Plot[Evaluate[
   Callout[s*(1 + r/12)^(y) + m*((1 + r/12)^y - 1)/(r/12),
      StringJoin["Intercept=",
       ToString[#]], #] &@((Solve[
          s*(1 + r/12)^(y) + m*((1 + r/12)^y - 1)/(r/12) == g, y] //
         Flatten // Values)[[1]])], {y, 1, 36},
  GridLines -> {None, {g}}, PlotRange -> {0, g*1.1},
  GridLinesStyle -> Directive[Red, Thick],
  AxesLabel -> {"Months", "Fr"},
  PlotLabel -> "Saving Calculator"], {{s, 100, "Initial Savings"}, 0,
  10000, 100, Appearance -> "Labeled"}, {{r, 0.05, "Interest Rate"},
  0, 0.1, 0.01, Appearance -> "Labeled"}, {{m, 50, "Monthly Savings"},
   0, 500, 10, Appearance -> "Labeled"}, {{g, 5000, "Saving Goal"},
  1000, 100000, 1000, Appearance -> "Labeled"}]

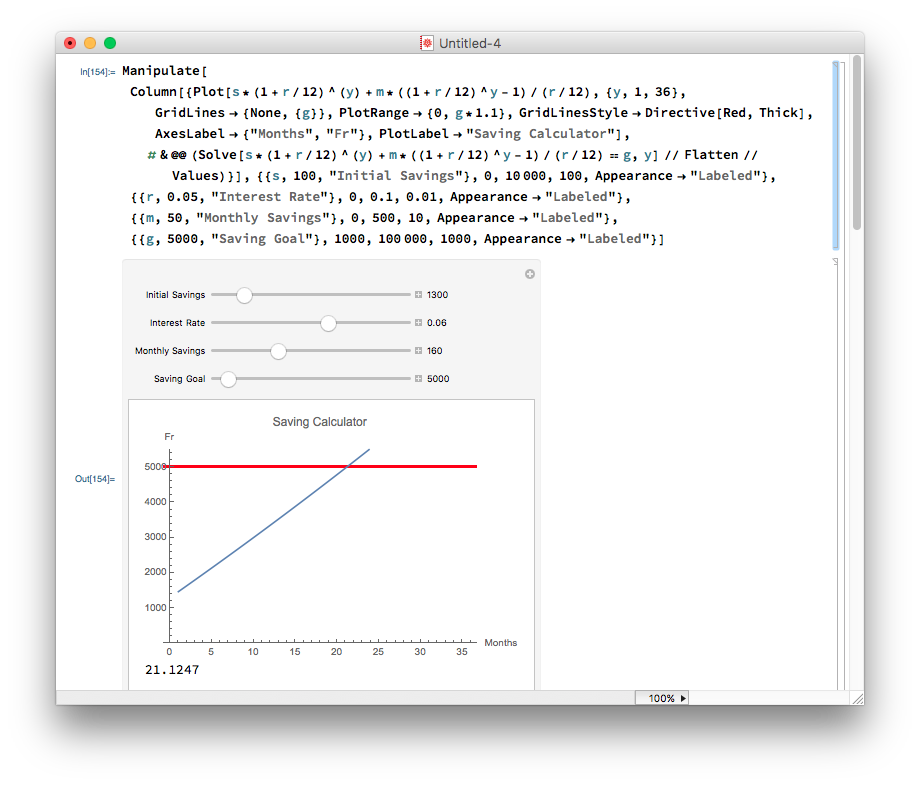
Or be shown separately?
   Manipulate[
 Column[{Plot[
    s*(1 + r/12)^(y) + m*((1 + r/12)^y - 1)/(r/12), {y, 1, 36},
    GridLines -> {None, {g}}, PlotRange -> {0, g*1.1},
    GridLinesStyle -> Directive[Red, Thick],
    AxesLabel -> {"Months", "Fr"},
    PlotLabel ->
     "Saving Calculator"], (Solve[
        s*(1 + r/12)^(y) + m*((1 + r/12)^y - 1)/(r/12) == g, y] //
       Flatten // Values)[[1]]}], {{s, 100, "Initial Savings"}, 0,
  10000, 100, Appearance -> "Labeled"}, {{r, 0.05, "Interest Rate"},
  0, 0.1, 0.01, Appearance -> "Labeled"}, {{m, 50, "Monthly Savings"},
   0, 500, 10, Appearance -> "Labeled"}, {{g, 5000, "Saving Goal"},
  1000, 100000, 1000, Appearance -> "Labeled"}]

P.S. these could definitely be optimized, but should do the trick. Assigning the equation to a variable should make things nicer


