3
$\begingroup$
Garfield = {
    Graphics[Line[{{1,3},{1,5},{2,6},{2,9},{3,10},{4,10},{5,9},{5.5,8},{6,9},{7,10},{8,10},{9,9},{9,6},{10,5},{10,3},{9,2},{7,1},{4,1},{2,2},{1,3}}]],
    Graphics[Line[{{2.5,3.5},{3,4},{3.5,3},{4.5,3},{5.5,4},{6.5,3},{7.5,3},{8,4},{8.5,3.5}}]],
    Graphics[Line[{{5,4},{6,4},{6,4.5},{5,4.5},{5,4}}]],
    Graphics[Line[{{8.5,3.5},{9,3.5},{9,4.5},{2,4.5},{2,3.5},{2.5,3.5}}]],
    Graphics[Line[{{3,4.5},{5,4.5},{5,7},{3,7},{3,4.5}}]],
    Graphics[Line[{{6,4.5},{8,4.5},{8,7},{6,7},{6,4.5}}]],
    Graphics[Line[{{4,5},{4.5,5},{4.5,6},{4,6},{4,5}}]],
    Graphics[Line[{{6.5,5},{7,5},{7,6},{6.5,6},{6.5,5}}]],
    Graphics[Epilog -> {PointSize[Large], Red, {1, 3}}]
};


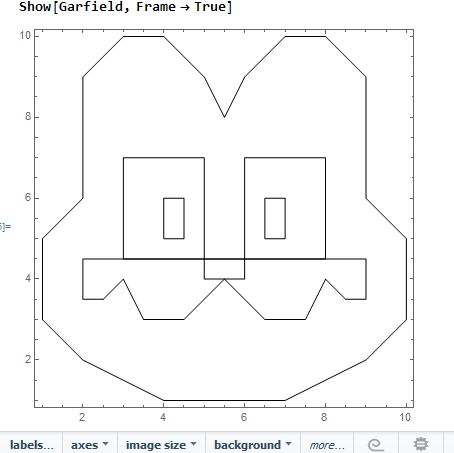
Show[Garfield, Frame -> True]

enter image description here

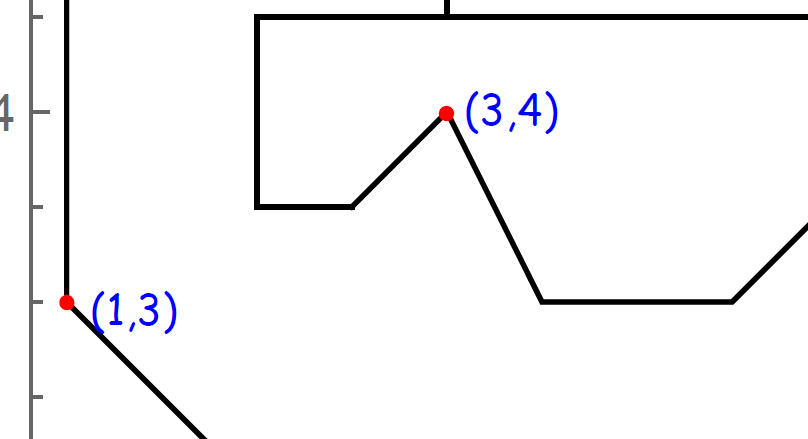
It displays fine, but with no Point in red. How do I get each point to display and with their coordinates like this?

enter image description here

Additionally

It would seem a bit excessive to show (x,y) for all points, could we make something more flexible like,

...
...
Graphics[Line[{showp{8.5,3.5},{9,3.5},{9,4.5},showp{2,4.5},{2,3.5},{2.5,3.5}}]],
...
...

where we use showp to indicate we want to show these points in that particular segment of drawing?

Thanks.

$\endgroup$
1
  • $\begingroup$ @m_goldberg Sorry can't see you comment, but I did get a notification on my app on the phone ... $\endgroup$ Commented Aug 9, 2018 at 0:03

2 Answers 2

2
$\begingroup$

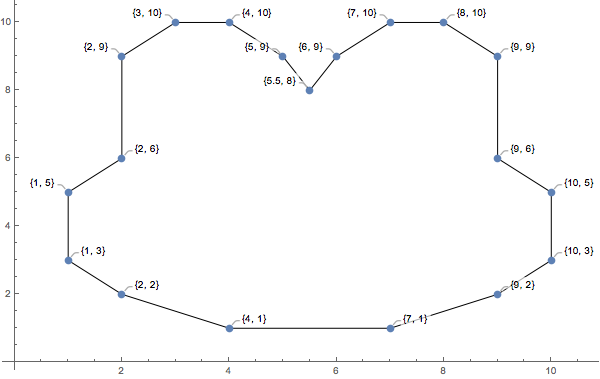
Callout can help you position the labels. I will let you experiment with the options so that the display gets right, but here is a start:

coords = {{1, 3}, {1, 5}, {2, 6}, {2, 9}, {3, 10}, {4, 10}, {5, 9}, {5.5, 8}, {6, 9}, {7, 10}, {8, 10}, {9, 9}, {9, 6}, {10, 5}, {10, 3}, {9, 2}, {7, 1}, {4, 1}, {2, 2}};
callouts = Callout[#, #] & /@ coords;
ListPlot[callouts, Prolog -> Line[Append[coords, {1, 3}]], ImageSize -> 600]

Mathematica graphics

$\endgroup$
6
  • $\begingroup$ I am looking at this on my iPad, just a very crude observation here, did {1,3} get "covered up" by {1,5}? I assume that's what you want me to experiment with? Otherwise this random "position" seem ok. $\endgroup$ Commented Aug 9, 2018 at 1:54
  • $\begingroup$ In comparison, {10,3} and {10,5} are living in harmony:) $\endgroup$ Commented Aug 9, 2018 at 1:55
  • $\begingroup$ Why add the completely unnecessary ToString? $\endgroup$
    – Carl Woll
    Commented Aug 9, 2018 at 3:43
  • $\begingroup$ @ChenStatsYu The point {1,3} doesn't get a callout because it is duplicated (it is the first and last point of coords). $\endgroup$
    – Carl Woll
    Commented Aug 9, 2018 at 3:57
  • $\begingroup$ @ChenStatsYu I have fixed the issue with the missing point in the way suggested by Carl. $\endgroup$
    – C. E.
    Commented Aug 9, 2018 at 9:43
1
$\begingroup$

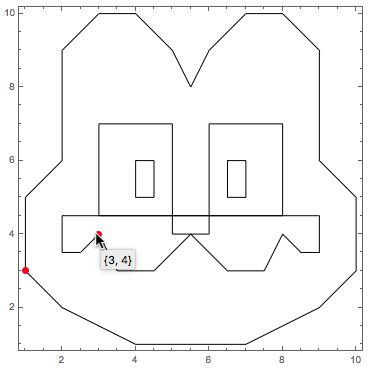
I don't like the idea of displaying the coordinates alongside the points. Positioning them is tricky and the drawing quickly becomes very cluttered. So I suggest labeling the points with tooltips that will only appear when the mouse cursor moves a point.

The necessary modification to your code is simple

Garfield = 
  {Graphics[Line[{{1, 3}, {1, 5}, {2, 6}, {2, 9}, {3, 10}, {4, 10}, {5, 9}, {5.5, 8}, {6, 9}, {7, 10}, {8, 10}, {9, 9}, {9, 6}, {10, 5}, {10, 3}, {9, 2}, {7, 1}, {4, 1}, {2, 2}, {1, 3}}]], 
   Graphics[Line[{{2.5, 3.5}, {3, 4}, {3.5, 3}, {4.5, 3}, {5.5, 4}, {6.5, 3}, {7.5, 3}, {8, 4}, {8.5, 3.5}}]], 
   Graphics[Line[{{5, 4}, {6, 4}, {6, 4.5}, {5, 4.5}, {5, 4}}]], 
   Graphics[Line[{{8.5, 3.5}, {9, 3.5}, {9, 4.5}, {2, 4.5}, {2, 3.5}, {2.5, 3.5}}]], 
   Graphics[Line[{{3, 4.5}, {5, 4.5}, {5, 7}, {3, 7}, {3, 4.5}}]], 
   Graphics[Line[{{6, 4.5}, {8, 4.5}, {8, 7}, {6, 7}, {6, 4.5}}]], 
   Graphics[Line[{{4, 5}, {4.5, 5}, {4.5, 6}, {4, 6}, {4, 5}}]], 
   Graphics[Line[{{6.5, 5}, {7, 5}, {7, 6}, {6.5, 6}, {6.5, 5}}]]};

pts = {{1, 3}, {3, 4}};

Show[
  Garfield,
  Graphics @ Tooltip[{PointSize[Large], Red, Point[#]}, #] & /@ pts,
  Frame -> True]

garfield

Of course, you need to modify pts to be the list of all the points you want to show.

If you don't like my solution using tooltips, which is quick and easy, you might want to look at a more elaborate solution I offer here that will allow you to put the coordinates anywhere you like.

Note: Graphics does not accept the Epilog option because it is never needed. Epilog is for Plot and its relatives.

$\endgroup$
2
  • 1
    $\begingroup$ The PointSize and color does not need to be repeated for each point. Show[Garfield, Graphics@{PointSize[Large], Red, Tooltip[Point[#], #] & /@ pts}, Frame -> True] $\endgroup$
    – Bob Hanlon
    Commented Aug 9, 2018 at 2:56
  • $\begingroup$ pts = Flatten[Garfield[[All, 1, 1]], 1]; to do it simply for all points of Garfied. $\endgroup$ Commented Oct 18, 2020 at 14:07

Your Answer

By clicking “Post Your Answer”, you agree to our terms of service and acknowledge you have read our privacy policy.

Not the answer you're looking for? Browse other questions tagged or ask your own question.