Referenced a previous answer
Source Link
m_goldberg
  • 108.1k
  • 16
  • 104
  • 259

I don't like the idea of displaying the coordinates along sidealongside the points. Positioning them is tricky and the drawing quickly becomes very cluttered. So I suggest labeling the points with tooltips that will only appear when the mouse cursor moves a point.

Of course, you need to modify pts to be the list of all the points you want to show.

If you don't like my solution using tooltips, which is quick and easy, you might want to look at a more elaborate solution I offer here that will allow you to put the coordinates anywhere you like.

Note: Graphics does not accept the Epilog option because it is never needed. Epilog is for Plot and its relatives.

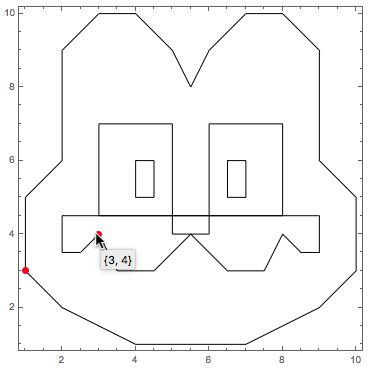
I don't like the idea of displaying the coordinates along side the points. Positioning them is tricky and the drawing quickly becomes very cluttered. So I suggest labeling the points with tooltips that will only appear when the mouse cursor moves a point.

Of course, you need to modify pts to be the list of all the points you want to show.

I don't like the idea of displaying the coordinates alongside the points. Positioning them is tricky and the drawing quickly becomes very cluttered. So I suggest labeling the points with tooltips that will only appear when the mouse cursor moves a point.

Of course, you need to modify pts to be the list of all the points you want to show.

If you don't like my solution using tooltips, which is quick and easy, you might want to look at a more elaborate solution I offer here that will allow you to put the coordinates anywhere you like.

Note: Graphics does not accept the Epilog option because it is never needed. Epilog is for Plot and its relatives.

Post Undeleted by m_goldberg
improved code
Source Link
m_goldberg
  • 108.1k
  • 16
  • 104
  • 259

SimpleI don't like the idea of displaying the coordinates along side the points. Just changePositioning them is tricky and the drawing quickly becomes very cluttered. So I suggest labeling the points with tooltips that will only appear when the mouse cursor moves a point.

The necessary modification to your code is simple

Garfield Graphics[Epilog= ->
  {PointSize[Large]Graphics[Line[{{1, Red3}, {1, 5}, {2, 6}, {2, 9}, {3, 10}, {4, 10}], {5, 9}, {5.5, 8}, {6, 9}, {7, 10}, {8, 10}, {9, 9}, {9, 6}, {10, 5}, {10, 3}, {9, 2}, {7, 1}, {4, 1}, {2, 2}, {1, 3}}]], 

to

 Graphics[  Graphics[Line[{PointSize[Large]{2.5, Red3.5}, Point[{3, 4}, {3.5, 3}, {4.5, 3}, {5.5, 4}, {6.5, 3}, {7.5, 3}, {8, 4}, {8.5, 3.5}}]], 
   Graphics[Line[{{5, 4}, {6, 4}, {6, 4.5}, {5, 4.5}, {5, 4}}]], 
   Graphics[Line[{{8.5, 3.5}, {9, 3.5}, {9, 4.5}, {2, 4.5}, {2, 3.5}, {2.5, 3.5}}]], 
   Graphics[Line[{{3, 4.5}, {5, 4.5}, {5, 7}, {3, 7}, {3, 4.5}}]], 
   Graphics[Line[{{6, 4.5}, {8, 4.5}, {8, 7}, {6, 7}, {6, 4.5}}]], 
   Graphics[Line[{{4, 5}, {4.5, 5}, {4.5, 6}, {4, 6}, {4, 5}}]], 
   Graphics[Line[{{6.5, 5}, {7, 5}, {7, 6}, {6.5, 6}, {6.5, 5}}]]};

pts = {{1, 3}], {3, 4}]};

Show[
  Garfield,
  Graphics @ Tooltip[{PointSize[Large], Red, Point[#]}, #] & /@ pts,
  Frame -> True]

garfield

Of course, you need to modify pts to be the list of all the points you want to show.

Simple. Just change

 Graphics[Epilog -> {PointSize[Large], Red, {1, 3}}]

to

 Graphics[{PointSize[Large], Red, Point[{1, 3}]}]

I don't like the idea of displaying the coordinates along side the points. Positioning them is tricky and the drawing quickly becomes very cluttered. So I suggest labeling the points with tooltips that will only appear when the mouse cursor moves a point.

The necessary modification to your code is simple

Garfield = 
  {Graphics[Line[{{1, 3}, {1, 5}, {2, 6}, {2, 9}, {3, 10}, {4, 10}, {5, 9}, {5.5, 8}, {6, 9}, {7, 10}, {8, 10}, {9, 9}, {9, 6}, {10, 5}, {10, 3}, {9, 2}, {7, 1}, {4, 1}, {2, 2}, {1, 3}}]], 
   Graphics[Line[{{2.5, 3.5}, {3, 4}, {3.5, 3}, {4.5, 3}, {5.5, 4}, {6.5, 3}, {7.5, 3}, {8, 4}, {8.5, 3.5}}]], 
   Graphics[Line[{{5, 4}, {6, 4}, {6, 4.5}, {5, 4.5}, {5, 4}}]], 
   Graphics[Line[{{8.5, 3.5}, {9, 3.5}, {9, 4.5}, {2, 4.5}, {2, 3.5}, {2.5, 3.5}}]], 
   Graphics[Line[{{3, 4.5}, {5, 4.5}, {5, 7}, {3, 7}, {3, 4.5}}]], 
   Graphics[Line[{{6, 4.5}, {8, 4.5}, {8, 7}, {6, 7}, {6, 4.5}}]], 
   Graphics[Line[{{4, 5}, {4.5, 5}, {4.5, 6}, {4, 6}, {4, 5}}]], 
   Graphics[Line[{{6.5, 5}, {7, 5}, {7, 6}, {6.5, 6}, {6.5, 5}}]]};

pts = {{1, 3}, {3, 4}};

Show[
  Garfield,
  Graphics @ Tooltip[{PointSize[Large], Red, Point[#]}, #] & /@ pts,
  Frame -> True]

garfield

Of course, you need to modify pts to be the list of all the points you want to show.

Post Deleted by m_goldberg
Source Link
m_goldberg
  • 108.1k
  • 16
  • 104
  • 259

Simple. Just change

 Graphics[Epilog -> {PointSize[Large], Red, {1, 3}}]

to

 Graphics[{PointSize[Large], Red, Point[{1, 3}]}]