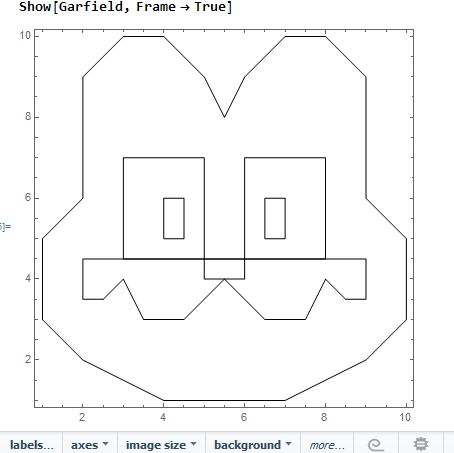
Garfield = {
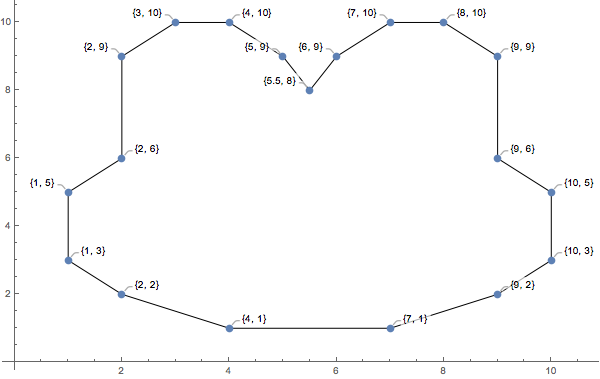
    Graphics[Line[{{1,3},{1,5},{2,6},{2,9},{3,10},{4,10},{5,9},{5.5,8},{6,9},{7,10},{8,10},{9,9},{9,6},{10,5},{10,3},{9,2},{7,1},{4,1},{2,2},{1,3}}]],
    Graphics[Line[{{2.5,3.5},{3,4},{3.5,3},{4.5,3},{5.5,4},{6.5,3},{7.5,3},{8,4},{8.5,3.5}}]],
    Graphics[Line[{{5,4},{6,4},{6,4.5},{5,4.5},{5,4}}]],
    Graphics[Line[{{8.5,3.5},{9,3.5},{9,4.5},{2,4.5},{2,3.5},{2.5,3.5}}]],
    Graphics[Line[{{3,4.5},{5,4.5},{5,7},{3,7},{3,4.5}}]],
    Graphics[Line[{{6,4.5},{8,4.5},{8,7},{6,7},{6,4.5}}]],
    Graphics[Line[{{4,5},{4.5,5},{4.5,6},{4,6},{4,5}}]],
    Graphics[Line[{{6.5,5},{7,5},{7,6},{6.5,6},{6.5,5}}]],
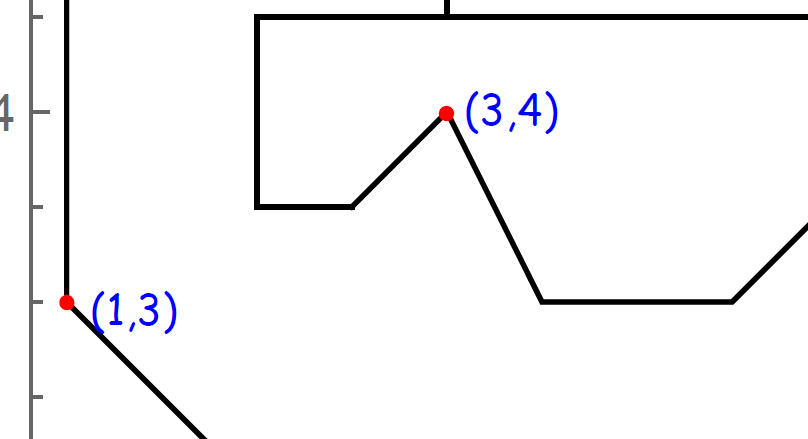
    Graphics[Epilog -> {PointSize[Large], Red, {1, 3}}]
};


Show[Garfield, Frame -> True]
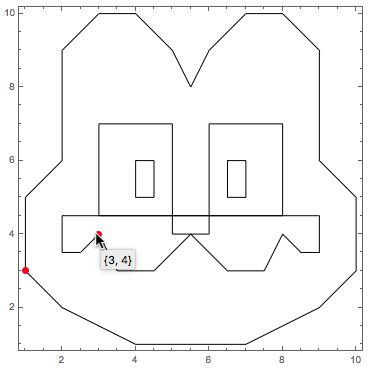
It displays fine, but with no Point in red. How do I get each point to display and with their coordinates like this?
Additionally
It would seem a bit excessive to show (x,y) for all points, could we make something more flexible like,
...
...
Graphics[Line[{showp{8.5,3.5},{9,3.5},{9,4.5},showp{2,4.5},{2,3.5},{2.5,3.5}}]],
...
...
where we use showp to indicate we want to show these points in that particular segment of drawing?
Thanks.


