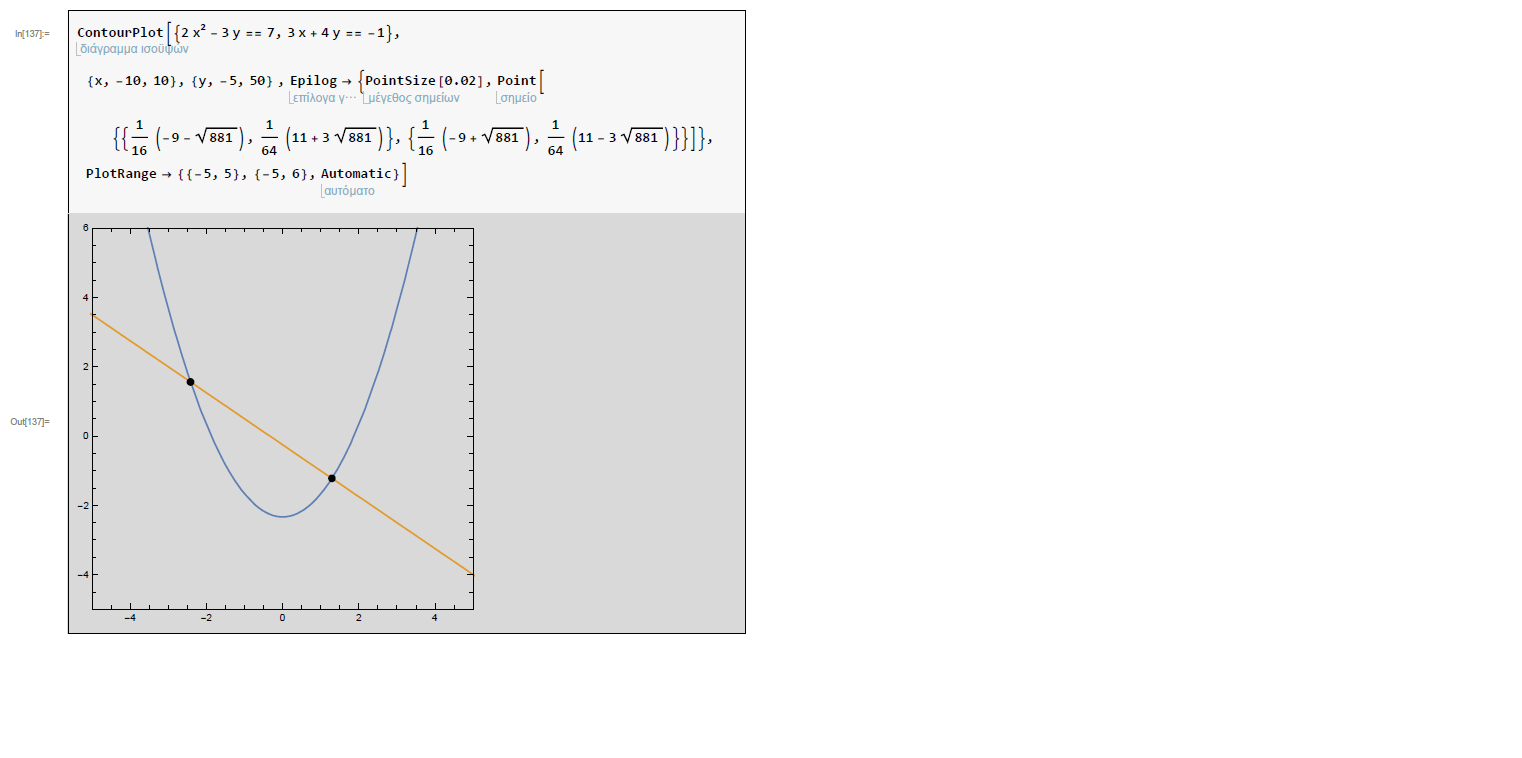
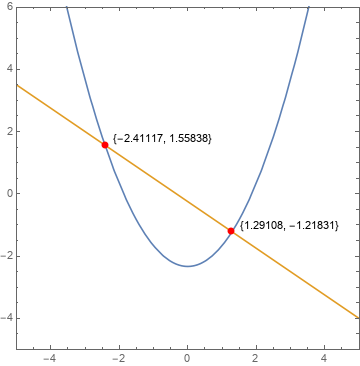
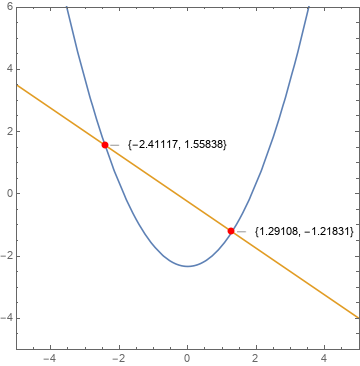
I am really new to MATHEMATICA and I am struggling to make a nice graph as follows:
I am stuck a bit as I cannot put labels on the intersection points....I do not want to use the drawing pallete as Microsoft Word has this option... Maybe an option would be to use Epilog for better graphics but I do not really know how to do that... labels with just the coords of the intersection points would be fine. Thanks for any advise.


ListPlotwithCalloutorLabeledto generate the points with labels, e.g.ListPlot[{Callout[{1, 2}, a], Callout[{3, 4}, b]}]$\endgroup$