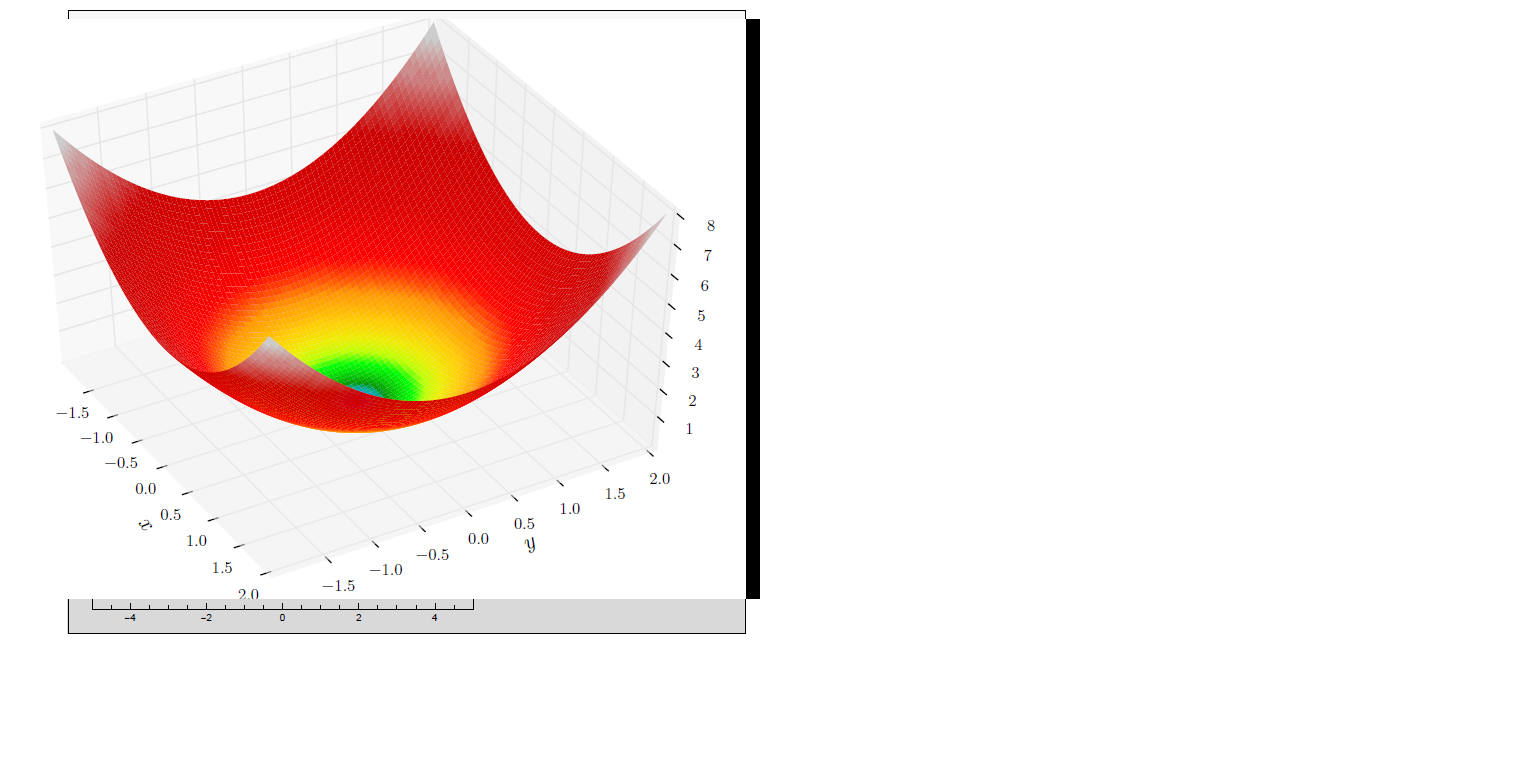
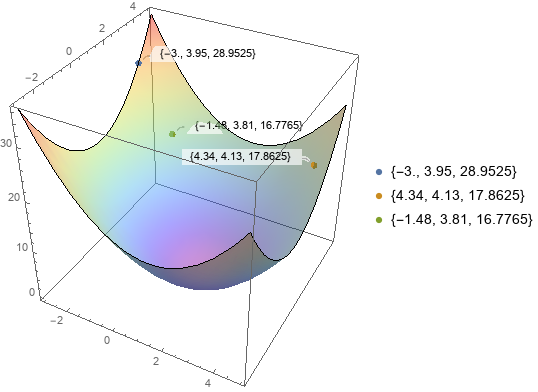
This question comes after I received some nice answers of yours, concerning the labeling of intersection points of two curves in the , see hereHow to label intersection point in Plot
The answers I received were really proffesional but quite difficult for my level, so I decided to create my own a more "brutal" algorith , like this:
In[76]:= Clear["Global`*"]
In[175]:= Solve[{2 x^2-3 y-7==0,3 x+4 y+1==0},{x,y}]
Out[175]= {{x->1/16 (-9-Sqrt[881]),y->1/64 (11+3 Sqrt[881])},{x->1/16 (-9+Sqrt[881]),y->1/64 (11-3 Sqrt[881])}}
In[179]:= N[{{x->1/16 (-9-Sqrt[881]),y->1/64 (11+3 Sqrt[881])},{x->1/16 (-9+Sqrt[881]),y->1/64 (11-3 Sqrt[881])}}]
Out[179]= {{x->-2.4176,y->1.5632},{x->1.2926,y->-1.21945}}
In[186]:= Show[ContourPlot[{2 x^2-3 y-7==0,3 x+4 y+1==0},{x,-10,10},{y,-5,50},PlotRange->{{-5,5},{-5,6},All}],ListPlot[{{1/16 (-9-Sqrt[881]),1/64 (11+3 Sqrt[881])},{1/16 (-9+Sqrt[881]),1/64 (11-3 Sqrt[881])}}->{"{-2.417,1.563}","{1.292,-1.219}"},LabelingFunction->Bottom]] Out[186]=
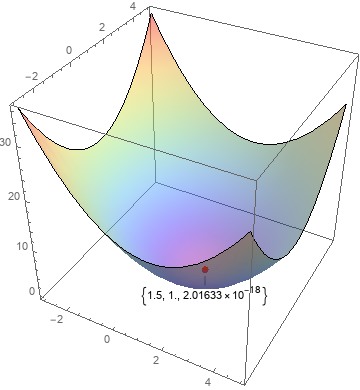
That is fine for me at the moment but then I wanted to do a similar thing in a Plot3D, for example I wanted to label the minimum point in the sphere function:
Notice that I can find the minimum first but the difficulty for me is to use the ListPlot[] here with Plot3D[], inside the Show[].
Can you give me any advise please?


