6
$\begingroup$

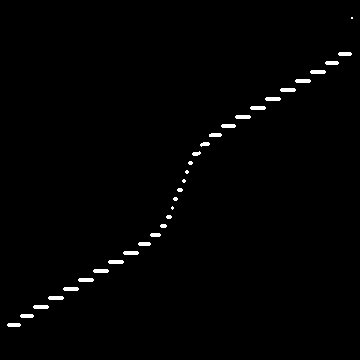
I have such points

pts=Uncompress[FromCharacterCode[
  Flatten[ImageData[Import["https://i.sstatic.net/hkAK8.png"],"Byte"]]]];

{{79.044,235.992},{94.9421,235.945},{111.087,235.922},...,,{511.07,12.0754},{527.079,11.9187},{590.997,12.0931}}

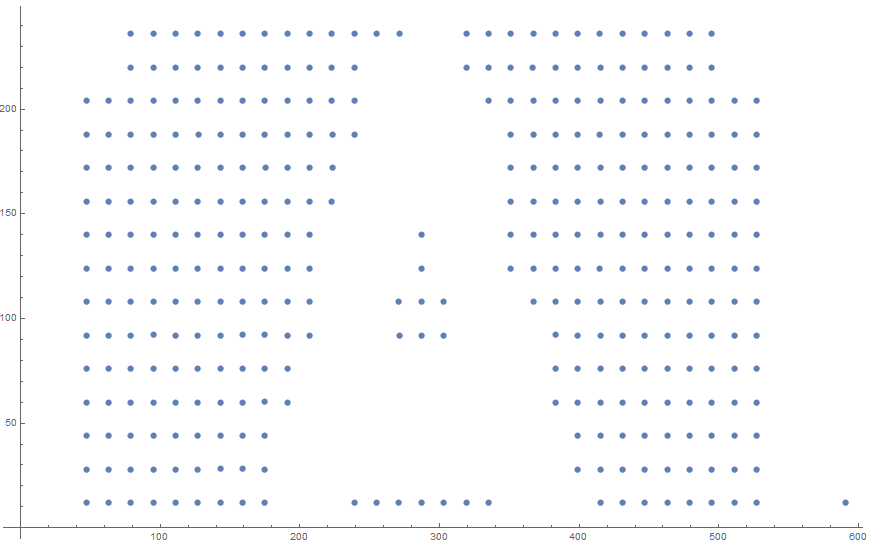
I can show it like following

ListPlot[pts]

How to know these point have 15 rows and 32 columns?

$\endgroup$
5
  • 2
    $\begingroup$ But they only approximately have 15 rows. Of the 345 points, there are 345 unique x values. You would need to Round the values to get the bins you are looking for. $\endgroup$
    – Jason B.
    Commented Apr 17, 2018 at 17:19
  • $\begingroup$ @JasonB. yes, the approximate beat me.. $\endgroup$
    – yode
    Commented Apr 17, 2018 at 17:25
  • $\begingroup$ I count 32 columns (you have a lone point in the lower right), and this: Length /@ DeleteDuplicates /@ (Round[#, 1] & /@ Transpose[pts]) yields {32, 15}. $\endgroup$
    – corey979
    Commented Apr 17, 2018 at 17:26
  • $\begingroup$ @corey979 Thanks, I just don't like the 1. Because sometimes it does not just differ 1 in the same column..Such as for pts*100 $\endgroup$
    – yode
    Commented Apr 17, 2018 at 17:29
  • $\begingroup$ @corey979 right, I didn't focus on comments $\endgroup$
    – Kuba
    Commented Apr 17, 2018 at 18:56

3 Answers 3

7
$\begingroup$

It's been some time since I played with image processing, so I gave it a try. (A one-liner at the end.)

pts = Uncompress[
   FromCharacterCode[
    Flatten[ImageData[Import["https://i.sstatic.net/hkAK8.png"], 
      "Byte"]]]];

{x, y} = Transpose@pts;

And simply

a = ColorNegate@
  Binarize@ListPlot[Sort@x, Axes -> False, PlotStyle -> Black, 
    AspectRatio -> 1]

enter image description here

b = ColorNegate@
  Binarize@ListPlot[Sort@y, Axes -> False, PlotStyle -> Black, 
    AspectRatio -> 1]

enter image description here

Finally

Max /@ MorphologicalComponents /@ {a, b}

{32, 15}

As it operates directly on an image, it's scaling-independent.


Wrapping it into a pure function:

gridDimension = 
 Max /@ MorphologicalComponents /@ (ColorNegate@Binarize@
        ListPlot[Sort@#, Axes -> False, PlotStyle -> Black, AspectRatio -> 1] & /@ Transpose@#) &

which works simply like

gridDimension@pts

{32, 15}

$\endgroup$
1
  • $\begingroup$ It's.. wonderful.. $\endgroup$
    – yode
    Commented Apr 18, 2018 at 2:26
6
$\begingroup$

Going off of @corey979 's comment. A slightly more rigorous way to fix your problem with corey's comment is to use the standard deviation, as opposed to the arbitrary rounding of 1.

    Length /@ 
 DeleteDuplicates /@ {Round[#, 
      StandardDeviation[pts][[1]]/35] & /@ 
    Transpose[
      pts][[1]], (Round[#, 
       StandardDeviation[pts][[2]]/36] & /@ 
     Transpose[pts][[2]])}

Note that the 35 and 36 are arbitrary, and you should modify them to whatever works best for you.

Also, this works for a*pts. In other words, this method is scale invariant, as you requested.

P.S. A prettier version of the code doesn't give the correct answer, unfortunately

Length /@ 
 DeleteDuplicates /@ (Round[#, StandardDeviation[#]/35] & /@ 
    Transpose[pts]) 
$\endgroup$
5
  • 2
    $\begingroup$ Almost, but this gives {32, 16} instead of {32, 15}. And you just changed an arbitrary 1 into an arbitrary 35. $\endgroup$
    – corey979
    Commented Apr 17, 2018 at 18:59
  • $\begingroup$ While the 35 is arbitrary, it does have the benefit of being scale invariant. Using 1 would mean you would need to replace the 1 with a more suitable number whenever you scaled pts. You're right, I did just make up the 35, but at least it does not need to be changed when you scale the points. $\endgroup$
    – Max Coplan
    Commented Apr 17, 2018 at 19:03
  • 1
    $\begingroup$ Well, nevertheless your code simply gives an incorrect answer. But it's indeed scalable, so if you can fix it, it looks like a valid, and general enough, approach. $\endgroup$
    – corey979
    Commented Apr 17, 2018 at 19:11
  • $\begingroup$ Really going off the bend here, rounding the x and y coordinates by two different numbers seems to both give the correct answer and scale invariant. But I have no explanation for why these two numbers work $\endgroup$
    – Max Coplan
    Commented Apr 17, 2018 at 19:51
  • 1
    $\begingroup$ +1. Now I like it :) $\endgroup$
    – corey979
    Commented Apr 17, 2018 at 19:55
2
$\begingroup$

By my count (or illogic) there are 35 columns and 15 rows. If we assume that the points are closely (but not necessarily exactly) aligned on a grid, then there should exist for all points values $n$, $x_{min}$, $x_{max}$, and some integer $i$ such that

$$x \approx x_{min} + (x_{max}-x_{min})i/n$$

The integer value $i$ is estimated to be

Round[(n (x - xmin))/(xmax - xmax)]

$x_{min}$ and $x_{max}$ can be approximated by the min and max of the list of numbers.

Putting this altogether is the following code:

nMax = 100;
{xmin, xmax} = MinMax[pts[[All, 1]]];
t = Table[{n, Total[Abs[# - xmin - (xmax - xmin) Round[(n (# - xmin))/(xmax - xmin)]/n] & 
   /@ pts[[All, 1]]]}, {n, 1, nMax}];
nx = 1 + Position[t, Min[t[[All, 2]]]][[1, 1]]
(* 35 *)

nMax = 100;
{ymin, ymax} = MinMax[pts[[All, 2]]];
t = Table[{n, Total[Abs[# - ymin - (ymax - ymin) Round[(n (# - ymin))/(ymax - ymin)]/n] &
  /@ pts[[All, 2]]]}, {n, 1, nMax}];
ny = 1 + Position[t, Min[t[[All, 2]]]][[1, 1]]
(* 15 *)

Here is a figure showing the grid lines:

ListPlot[pts, PlotStyle -> Blue, 
 GridLines -> {xmin + (xmax - xmin) Range[0, nx - 1]/(nx - 1), 
   ymin + (ymax - ymin) Range[0, ny - 1]/(ny - 1)}]
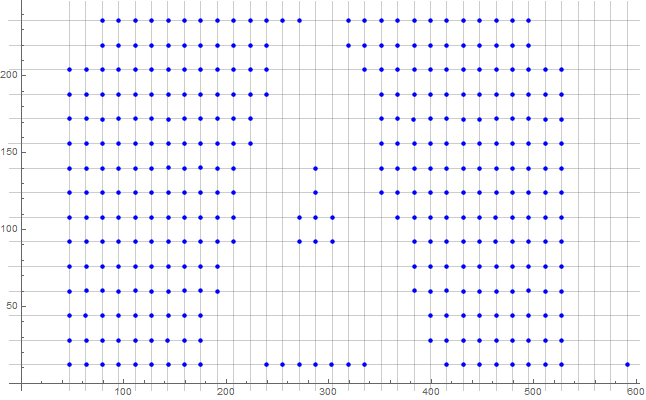
Points and grid lines

Note that I've set nMax to the maximum value of the dimension that I would expect. (And this can certainly be made more robust. I've used Table to generate a list of possible values as I couldn't get Minimize to converge to the desired solution.)
$\endgroup$

Your Answer

By clicking “Post Your Answer”, you agree to our terms of service and acknowledge you have read our privacy policy.

Not the answer you're looking for? Browse other questions tagged or ask your own question.