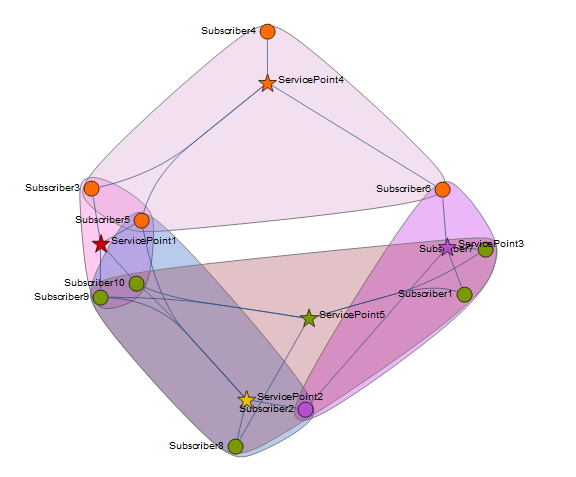
If you have IGraphM you can use the function IGBipartiteIncidenceGraph using your matrix X input:
<< IGraphM`

subscribers = "Subscriber" <> ToString[#] & /@ Range[First@Dimensions[X]];

servicepoints = "ServicePoint" <> ToString[#] & /@ Range[Last@Dimensions[X]];

IGBipartiteIncidenceGraph[{subscribers, servicepoints}, X,
 GraphLayout -> {"MultipartiteEmbedding", "VertexPartition" -> Dimensions[X]},
 VertexLabels -> {v : Alternatives @@ subscribers :> Placed["Name", Before],
   v : Alternatives @@ servicepoints :> Placed["Name", After]},
 PerformanceGoal -> "Quality",
 ImagePadding -> {{70, 70}, {10, 10}},
 ImageSize -> Large]
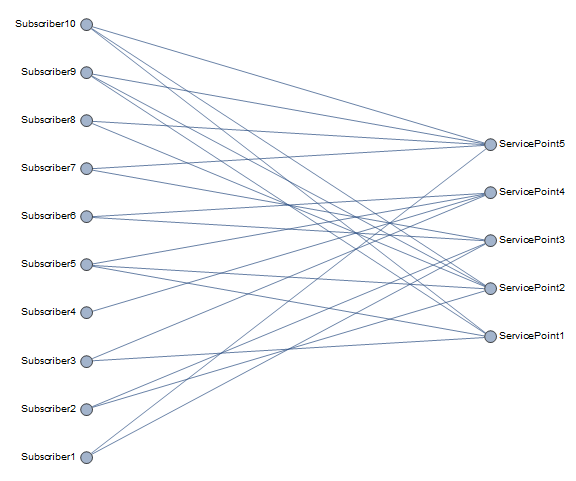
If you don't have IGraphM you can construct an AdjacencyMatrix from your X and use AdjacencyGraph:
vl = Join[subscribers, servicepoints];

am = ArrayFlatten[{{0, X}, {Transpose[X], 0}}];

AdjacencyGraph[vl, am,
 GraphLayout -> {"MultipartiteEmbedding", "VertexPartition" -> Dimensions[X]},
 VertexLabels -> {v : Alternatives @@ subscribers :>
    Placed["Name", Before],
   v : Alternatives @@ servicepoints :> Placed["Name", After]},
 PerformanceGoal -> "Quality", ImagePadding -> {{70, 70}, {10, 10}},
 ImageSize -> Large]
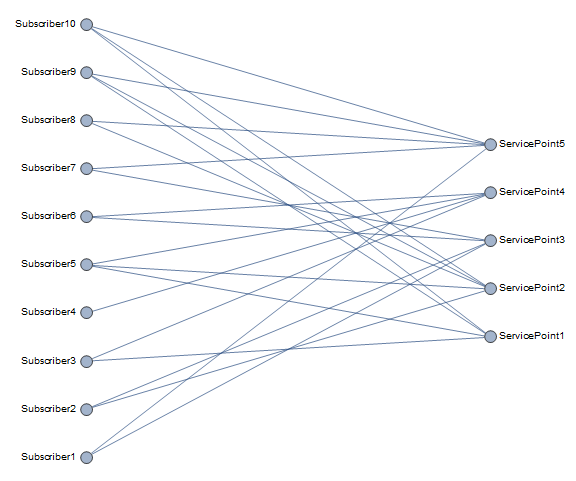
Remove the option GraphLayout and use coordinates of your choice as VertexCoordinates:
xsp = {200, 600, 200, 600, 400};
ysp = {200, 200, 600, 600, 400};

SeedRandom[1]
locations = Join[Thread[servicepoints -> Transpose[{xsp, ysp}]],
    Thread[subscribers -> RandomPoint[Rectangle[{0, 0}, {800, 800}], 10]]];

ag = AdjacencyGraph[vl, am, VertexCoordinates -> locations,
  VertexShapeFunction -> {v : Alternatives @@ servicepoints -> "Star"},
  VertexSize -> Large,
  VertexLabels -> {v : Alternatives @@ subscribers :>
     Placed["Name", Before],
    v : Alternatives @@ servicepoints :> Placed["Name", After]},
  PerformanceGoal -> "Quality", ImagePadding -> {{70, 70}, {10, 10}},
  ImageSize -> Large]
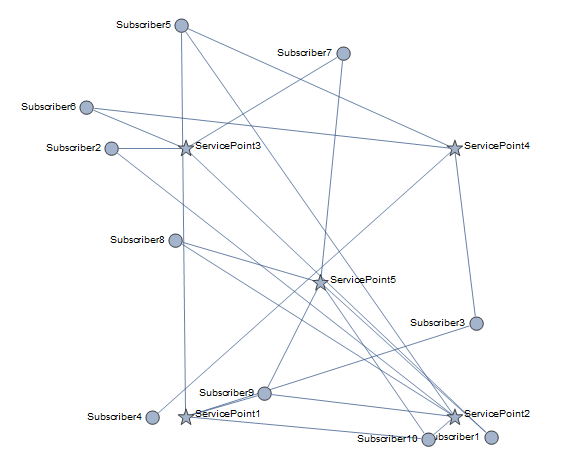
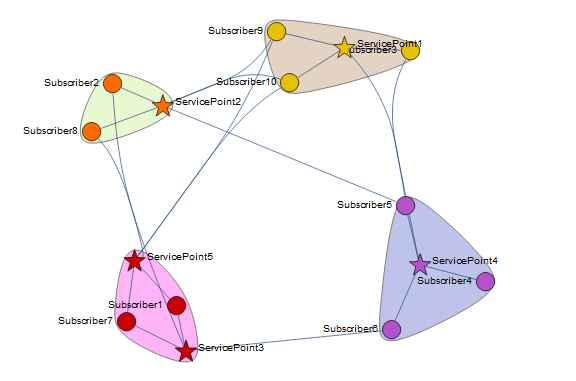
We can also use CommunityGraphPlot:
- Using the default community structure:
CommunityGraphPlot[ag,
 CommunityRegionStyle -> (Opacity[.3, #] & /@ RandomColor[10])]
Or, using the option Method -> "Hierarchical":
CommunityGraphPlot[ag,
 CommunityRegionStyle -> (Opacity[.3, #] & /@ RandomColor[10]),
 Method -> "Hierarchical"]
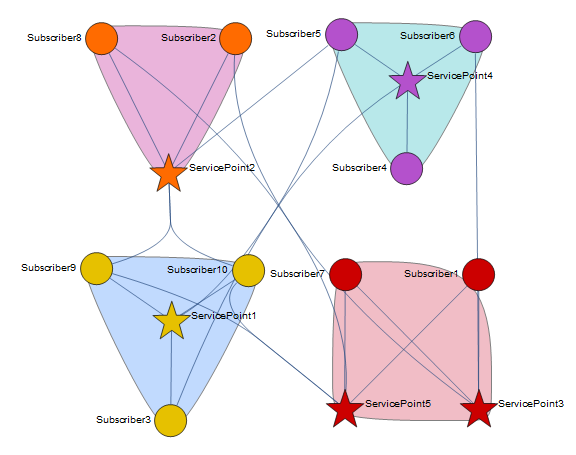
The automatic community structure used above is:
FindGraphCommunities[ag] // Column

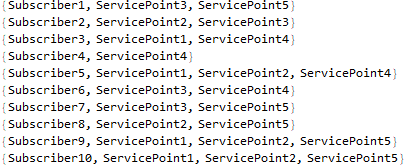
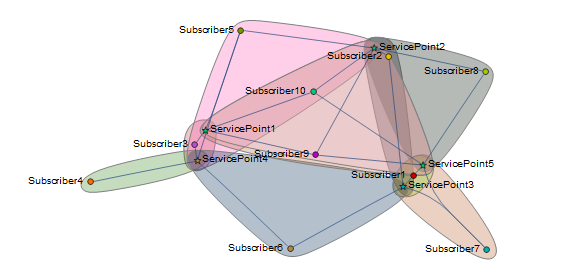
- Defining a custom community structure such that each subscriber
i together with service points connected to i form a community (cluster):
communitystructure1 = Prepend[AdjacencyList[ag, #], #] & /@ subscribers;
Column @ communitystructure1
CommunityGraphPlot[ag, communitystructure1,
 CommunityRegionStyle -> (Opacity[.3, #] & /@ RandomColor[10])]
- Defining a custom community structure such that each service point
j together with subscribers connected to j form a community (cluster):
communitystructure2 = Prepend[AdjacencyList[ag, #], #] & /@ servicepoints;
Column @ communitystructure2

CommunityGraphPlot[ag, communitystructure2,
 CommunityRegionStyle -> (Opacity[.3, #] & /@ RandomColor[10])]
