1
$\begingroup$

I have a binary matrix "X" of U rows and N columns. Each row of X has 1 to maximum 3 ones. Each row corresponds to a subscriber and every column corresponds to a service point. So, the ones in a given row corresponds to the service points that the subscriber can be served by.

How can I graphically show this association?

Lets say, we have 5 service points, randomly/systematically arranged over an area.

x-coordinates of the service points are {200, 600, 200, 600, 400}

y-coordinates of the service points are {200, 200, 600, 600, 400}

And we have 10 subscribers randomly distributed over the area with boundary points (0, 0), (0, 800), (800, 0) and (800, 800).

And the X matrix is given by

X = {{0, 0, 1, 0, 1}, {0, 1, 1, 0, 0}, {1, 0, 0, 1, 0}, {0, 0, 0, 1, 0}, 
     {1, 1, 0, 1, 0}, {0, 0, 1, 1, 0}, {0, 0, 1, 0, 1}, {0, 1, 0, 0, 1},
     {1, 1, 0, 0, 1}, {1, 1, 0, 0, 1}};

How to graphically show this connections?

Lets say, we call the set of service points associated with given users a clusters. So, different subscribers will have different clusters. I just want to see the relationship of different clusters for different users, for example, if two nearby subscribers have the same cluster or they have different clusters?

$\endgroup$
3
  • $\begingroup$ Start by at least representing your matrices in Mathematica code, i.e. as nested lists. Then, are you looking to generate a graph output? Or some kind of plot? $\endgroup$
    – MarcoB
    Commented Nov 16, 2020 at 0:03
  • $\begingroup$ @MarcoB, I prefer graph output. Plots are also welcome. $\endgroup$
    – MGK
    Commented Nov 16, 2020 at 0:04
  • $\begingroup$ I am not sure that this is a Mathematica question yet. You should tell us how you want the relationship represented, and then somebody can help you construct the graph you need. $\endgroup$
    – MarcoB
    Commented Nov 16, 2020 at 0:16

1 Answer 1

4
$\begingroup$

If you have IGraphM you can use the function IGBipartiteIncidenceGraph using your matrix X input:

<< IGraphM`

subscribers = "Subscriber" <> ToString[#] & /@ Range[First@Dimensions[X]];

servicepoints = "ServicePoint" <> ToString[#] & /@ Range[Last@Dimensions[X]];

IGBipartiteIncidenceGraph[{subscribers, servicepoints}, X, 
 GraphLayout -> {"MultipartiteEmbedding", "VertexPartition" -> Dimensions[X]}, 
 VertexLabels -> {v : Alternatives @@ subscribers :> Placed["Name", Before], 
   v : Alternatives @@ servicepoints :> Placed["Name", After]},  
 PerformanceGoal -> "Quality", 
 ImagePadding -> {{70, 70}, {10, 10}}, 
 ImageSize -> Large]
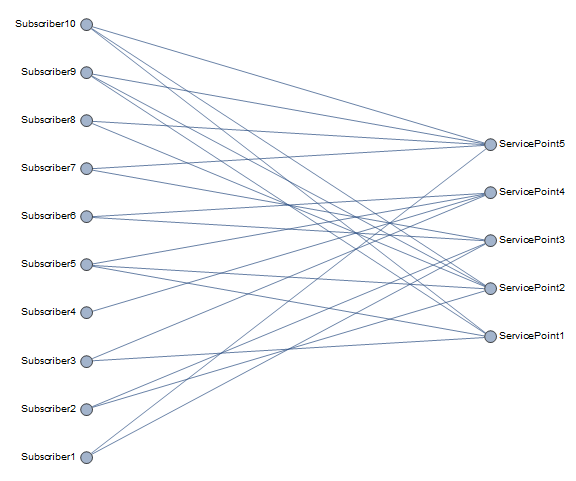
enter image description here

If you don't have IGraphM you can construct an AdjacencyMatrix from your X and use AdjacencyGraph:

vl = Join[subscribers, servicepoints];

am = ArrayFlatten[{{0, X}, {Transpose[X], 0}}];

AdjacencyGraph[vl, am, 
 GraphLayout -> {"MultipartiteEmbedding", "VertexPartition" -> Dimensions[X]}, 
 VertexLabels -> {v : Alternatives @@ subscribers :> 
    Placed["Name", Before], 
   v : Alternatives @@ servicepoints :> Placed["Name", After]},  
 PerformanceGoal -> "Quality", ImagePadding -> {{70, 70}, {10, 10}}, 
 ImageSize -> Large]
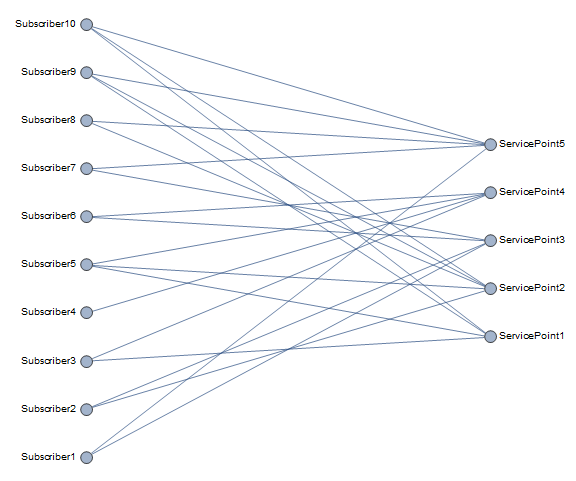
enter image description here

Remove the option GraphLayout and use coordinates of your choice as VertexCoordinates:

xsp = {200, 600, 200, 600, 400};
ysp = {200, 200, 600, 600, 400};

SeedRandom[1]
locations = Join[Thread[servicepoints -> Transpose[{xsp, ysp}]], 
    Thread[subscribers -> RandomPoint[Rectangle[{0, 0}, {800, 800}], 10]]];

ag = AdjacencyGraph[vl, am, VertexCoordinates -> locations,
  VertexShapeFunction -> {v : Alternatives @@ servicepoints -> "Star"},
  VertexSize -> Large, 
  VertexLabels -> {v : Alternatives @@ subscribers :> 
     Placed["Name", Before], 
    v : Alternatives @@ servicepoints :> Placed["Name", After]},  
  PerformanceGoal -> "Quality", ImagePadding -> {{70, 70}, {10, 10}}, 
  ImageSize -> Large]
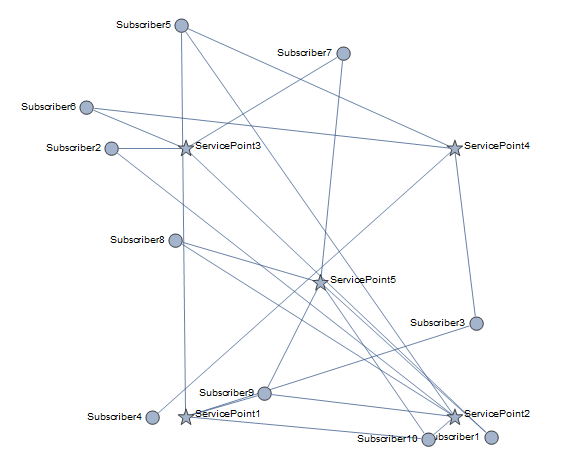
enter image description here

We can also use CommunityGraphPlot:

  1. Using the default community structure:

CommunityGraphPlot[ag, 
 CommunityRegionStyle -> (Opacity[.3, #] & /@ RandomColor[10])]
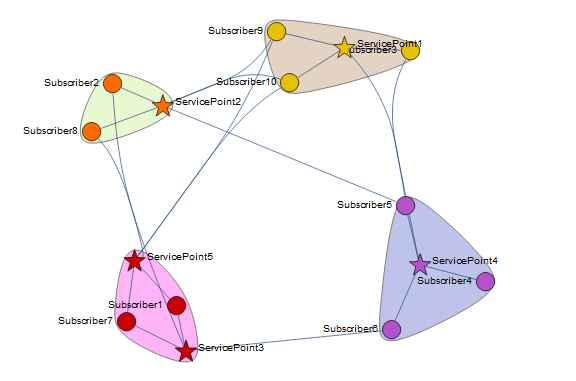
enter image description here

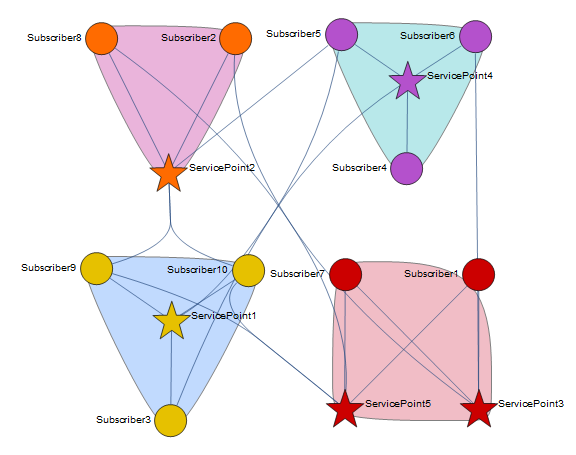
Or, using the option Method -> "Hierarchical":

CommunityGraphPlot[ag, 
 CommunityRegionStyle -> (Opacity[.3, #] & /@ RandomColor[10]), 
 Method -> "Hierarchical"]
enter image description here

The automatic community structure used above is:

FindGraphCommunities[ag] // Column

enter image description here

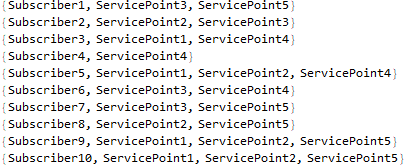
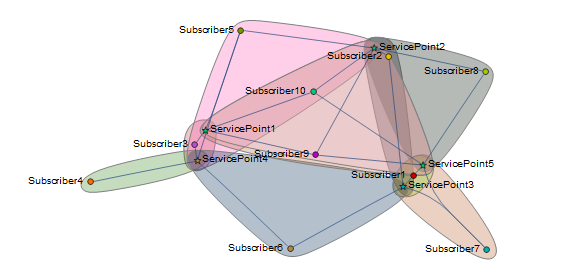
  1. Defining a custom community structure such that each subscriber i together with service points connected to i form a community (cluster):

communitystructure1 = Prepend[AdjacencyList[ag, #], #] & /@ subscribers;
Column @ communitystructure1
enter image description here

CommunityGraphPlot[ag, communitystructure1, 
 CommunityRegionStyle -> (Opacity[.3, #] & /@ RandomColor[10])]
enter image description here

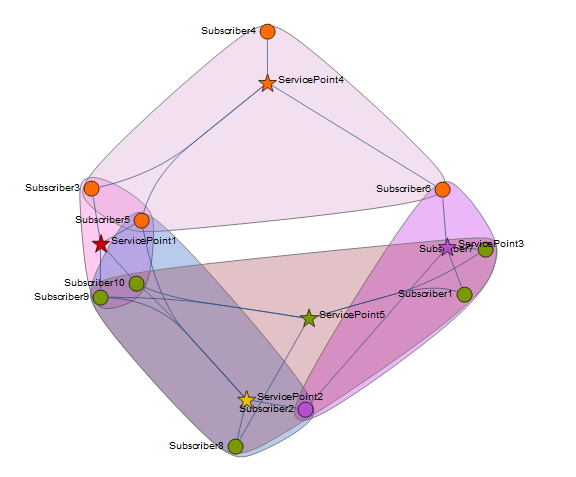
  1. Defining a custom community structure such that each service point j together with subscribers connected to j form a community (cluster):

communitystructure2 = Prepend[AdjacencyList[ag, #], #] & /@ servicepoints;
Column @ communitystructure2

enter image description here

CommunityGraphPlot[ag, communitystructure2, 
 CommunityRegionStyle -> (Opacity[.3, #] & /@ RandomColor[10])]
enter image description here

$\endgroup$
2
  • 1
    $\begingroup$ would you please explain a bit the last two graphs. Also, why there are three different sets of subscribers (as we have three colors to distinguish the subscribers). In the last graph, we have 5 regions corresponding to 5 service points. Is it possible to have same color for the service points markers as their region $\endgroup$
    – MGK
    Commented Nov 16, 2020 at 10:46
  • 1
    $\begingroup$ @dipaknarayanan, I added some explanation re how the example community structures are formed. $\endgroup$
    – kglr
    Commented Nov 16, 2020 at 10:57

Your Answer

By clicking “Post Your Answer”, you agree to our terms of service and acknowledge you have read our privacy policy.

Not the answer you're looking for? Browse other questions tagged or ask your own question.