I have a list like the following one:
fp= {{{0.0466667, {1., 0., 1., 0., 0.001, 0.001}},
{0.466667, {1., 0., 1.,0., 0.001, 0.001}},
{0.933333, {0.96462, -0.152292,
0.964462, -0.150309, -0.34624,
0.001}}, {1.4, {0.893323, -0.155954,
0.894545, -0.146644, -0.34624,
0.001}}, {1.86667, {0.819594, -0.158172,
0.827064, -0.144421, -0.34624,
0.001}}, {2.33333, {0.752722, -0.133854, 0.532049, -1.0509,
0.207436, 0.001}}, {2.8, {0.69019, -0.135593, 0.0416364, -1.0507,
0.207436,
0.001}}, {3.26667, {0.625794, -0.138358, -0.448723, -1.05079,
0.207436,
0.001}}, {3.73333, {0.540536, -0.228625, -0.920832, -0.946004,
0.00129341,
0.001}}, {4.2, {0.433845, -0.228625, -1.3623, -0.946004,
0.00129341, 0.001}}}, {{0.0466667, {0.204667, 0.1, 0.2, 0., 0.001,
 0.001}}, {0.466667, {0.246667, 0.1, 0.2, 0., 0.001,
0.001}}, {0.933333, {0.28364, 0.0591502,
0.192892, -0.0300618, -0.0927254, 0.001}}, {1.4, {0.311167,
0.0579028, 0.178909, -0.0293287, -0.0927254,
0.001}}, {1.86667, {0.337853, 0.0571194,
0.165413, -0.0288842, -0.0927254, 0.001}}, {2.33333, {0.366418,
0.067623, 0.10641, -0.210181, 0.15529, 0.001}}, {2.8, {0.397937,
0.0666345, 0.00832728, -0.21014, 0.15529,
0.001}}, {3.26667, {0.428374, 0.0650039, -0.0897445, -0.210159,
0.15529,
0.001}}, {3.73333, {0.442932, -0.00234043, -0.184166, -0.189201,
0.00129314,
0.001}}, {4.2, {0.44184, -0.00234043, -0.27246, -0.189201,
0.00129314, 0.001}}}}
It has the structure of:
{{
 {a11,{a12,a13,a14..}}
 {a21,{a22,a23,a24..}}
       ....
 }
 {
 {b11,{b12,b13,b14..}}
 {b21,{b22,b23,b24..}}
       ....
 }
       same structure for c,d,e,....
 }
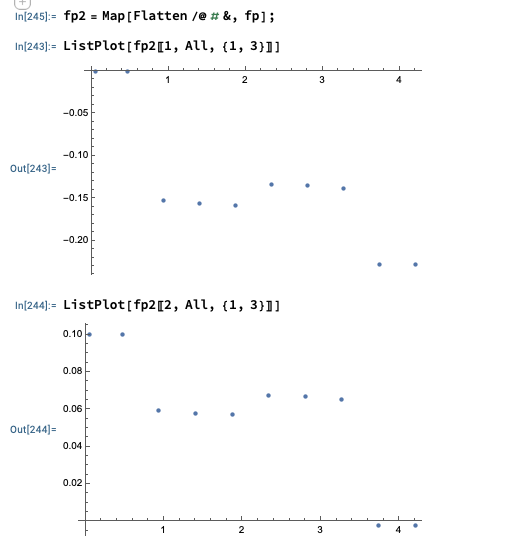
I would like to make listplot for one curve of {ai1, ai3} and another cure of {bi1, bi3}. How I can generate such lists for listplot? I tried flatten, but to no avail.
I did the following:
Transpose[{fp[[1]][[All, 1]], fp[[1]][[All, 2]][[All, 3]]}]

