2
$\begingroup$

I have a .jpg image named r. I am using the following code to plot a histogram:

r // ImageData // Flatten // Histogram

Is it correct? Another task is to apply Histogram3D. However, I am unable to use Histogram3D. I know I need to convert my data into a 2D list but I am having difficulties figuring out how.

$\endgroup$
3
  • 1
    $\begingroup$ Have you seen ImageHistogram[] already? $\endgroup$ Commented Sep 19, 2017 at 13:49
  • 2
    $\begingroup$ This seems to be related to some homework, I assume, as there is another new user with almost the same problem, none has managed to explain why they want to use Histogram3D with and RGB array of data. $\endgroup$
    – rhermans
    Commented Sep 19, 2017 at 13:49
  • $\begingroup$ @J.M., I did look at ImageHistogram. This is part of an assignment and Histogram3D is required. I need to manipulate the data into a 2D list in order to be able to use Histogram3D. Nothing that I tried worked as I am ending up with a 3D list. $\endgroup$
    – user94948
    Commented Sep 19, 2017 at 14:05

1 Answer 1

3
$\begingroup$

ImageHistogram

If you have a colour image, such as

img = ImageResize[ExampleData[{"TestImage", "Apples"}], 100]

Mathematica graphics

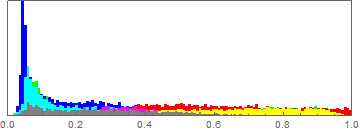
As mentioned by JM, there is ImageHistogram

ImageHistogram[img]
Mathematica graphics

Dimensions

But for some reason you have NOT explained, you want to use Histogram3D, which takes arguments in the form of list of pairs of values.

Then the number of colour channels is 3

ImageChannels[img]

That implies that the dimensions of the data array, is the dimensions of the pixel array and depth 3.

Dimensions[ImageData[img]]
(* {67, 100, 3} *)

So the data is incompatible.

Re-arrange

Of course you could rearrange the data.

Partition[Flatten[ImageData[img]], 2]

or

ArrayReshape[
 ImageData[img]
 , {Times @@ Dimensions[ImageData[img]]/2, 2}
 ]

but then you are mixing the RGB values and

{{r[1], g[1], b[1]}, {r[2], g[2], b[2]}, {r[3], g[3], b[3]}, {r[4], 
  g[4], b[4]}, {r[5], g[5], b[5]}, ... , {r[n], g[n], b[n]}}

becomes

{{r[1], g[1]}, {b[1], r[2]}, {g[2], b[2]}, {r[3], g[3]}, {b[3], 
  r[4]}, ... , {g[n], b[n]}}

Manipulate

you can process or manipulate the data to create some other set, for example averaging two channels

Map[{First[#], Mean[Rest[#]]} &,
 Flatten[ImageData[img], 1]
 ]

you will get something like

{{r[1], (b[1] + g[1])/2}, {r[2], (b[2] + g[2])/2},..., {r[n], (b[n] + g[n])/2}

Histogram3D

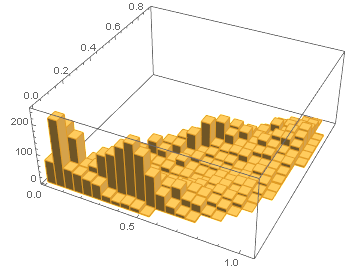
Whatever you did, then you can apply the Histogram3D to the array woth dimensions {n,2}

Dimensions@Map[{First[#], Mean[Rest[#]]} &,
  Flatten[ImageData[img], 1]
  ]
(* {6700, 2} *)

Histogram3D[
 Map[{First[#], Mean[Rest[#]]} &,
  Flatten[ImageData[img], 1]
  ]]
Mathematica graphics

$\endgroup$
4
  • 1
    $\begingroup$ True, the data is incompatible, but like I mentioned in the comments Histogram3D is a requirement in the question and I know that I need to manipulate the data. The methods you suggest work perfectly. Thanks! $\endgroup$
    – user94948
    Commented Sep 19, 2017 at 14:27
  • 4
    $\begingroup$ Congratulations rhermans! You get an A on this assignment! $\endgroup$
    – bill s
    Commented Sep 19, 2017 at 14:29
  • $\begingroup$ @bills What do I need to do for A+? $\endgroup$
    – rhermans
    Commented Sep 19, 2017 at 14:29
  • 1
    $\begingroup$ @bills Well, please let the students know that a better explanation of the problem is normally required here. I actually wanted to vote to close the question first... $\endgroup$
    – rhermans
    Commented Sep 19, 2017 at 14:35

Your Answer

By clicking “Post Your Answer”, you agree to our terms of service and acknowledge you have read our privacy policy.

Not the answer you're looking for? Browse other questions tagged or ask your own question.