added 119 characters in body
Source Link
rhermans
  • 37.4k
  • 4
  • 61
  • 152

ImageHistogram

If you have a colour image, such as

img = ImageResize[ExampleData[{"TestImage", "Apples"}], 100]

Mathematica graphics

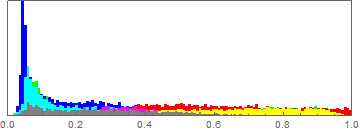
As mentioned by JM, there is ImageHistogram

ImageHistogram[img]
Mathematica graphics

Dimensions

But for some reason you have NOT explained, you want to use Histogram3D, which takes arguments in the form of list of pairs of values.

Then the number of colour channels is 3

ImageChannels[img]

That implies that the dimensions of the data array, is the dimensions of the pixel array and depth 3.

Dimensions[ImageData[img]]
(* {67, 100, 3} *)

So the data is incompatible.

Re-arrange

Of course you could rearrange the data.

Partition[Flatten[ImageData[img]], 2]

or

ArrayReshape[
 ImageData[img]
 , {Times @@ Dimensions[ImageData[img]]/2, 2}
 ]

but then you are mixing the RGB values and

{{r[1], g[1], b[1]}, {r[2], g[2], b[2]}, {r[3], g[3], b[3]}, {r[4], 
  g[4], b[4]}, {r[5], g[5], b[5]}, ... , {r[n], g[n], b[n]}}

becomes

{{r[1], g[1]}, {b[1], r[2]}, {g[2], b[2]}, {r[3], g[3]}, {b[3], 
  r[4]}, ... , {g[n], b[n]}}

Manipulate

you can process or manipulate the data to create some other set, for example averaging two channels

Map[{First[#], Mean[Rest[#]]} &,
 Flatten[ImageData[img], 1]
 ]

you will get something like

{{r[1], (b[1] + g[1])/2}, {r[2], (b[2] + g[2])/2},..., {r[n], (b[n] + g[n])/2}

Histogram3D

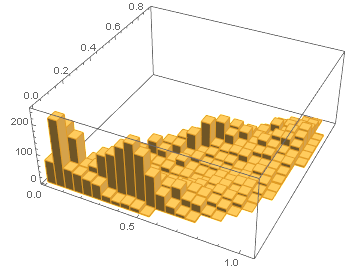
Whatever you did, then you can apply the Histogram3D to the array woth dimensions {n,2}

Dimensions@Map[{First[#], Mean[Rest[#]]} &,
  Flatten[ImageData[img], 1]
  ]
(* {6700, 2} *)

Histogram3D[
 Map[{First[#], Mean[Rest[#]]} &,
  Flatten[ImageData[img], 1]
  ]]
Mathematica graphics

ImageHistogram

If you have a colour image, such as

img = ImageResize[ExampleData[{"TestImage", "Apples"}], 100]

Mathematica graphics

As mentioned by JM, there is ImageHistogram

ImageHistogram[img]

Mathematica graphics

Dimensions

But for some reason you have NOT explained, you want to use Histogram3D, which takes arguments in the form of list of pairs of values.

Then the number of colour channels is 3

ImageChannels[img]

That implies that the dimensions of the data array, is the dimensions of the pixel array and depth 3.

Dimensions[ImageData[img]]
(* {67, 100, 3} *)

So the data is incompatible.

Re-arrange

Of course you could rearrange the data.

Partition[Flatten[ImageData[img]], 2]

or

ArrayReshape[
 ImageData[img]
 , {Times @@ Dimensions[ImageData[img]]/2, 2}
 ]

but then you are mixing the RGB values and

{{r[1], g[1], b[1]}, {r[2], g[2], b[2]}, {r[3], g[3], b[3]}, {r[4], 
  g[4], b[4]}, {r[5], g[5], b[5]}, ... , {r[n], g[n], b[n]}}

becomes

{{r[1], g[1]}, {b[1], r[2]}, {g[2], b[2]}, {r[3], g[3]}, {b[3], 
  r[4]}, ... , {g[n], b[n]}}

Manipulate

you can process or manipulate the data to create some other set, for example averaging two channels

Map[{First[#], Mean[Rest[#]]} &,
 Flatten[ImageData[img], 1]
 ]

Histogram3D

Whatever you did, then you can apply the Histogram3D to the array woth dimensions {n,2}

Dimensions@Map[{First[#], Mean[Rest[#]]} &,
  Flatten[ImageData[img], 1]
  ]
(* {6700, 2} *)

Histogram3D[
 Map[{First[#], Mean[Rest[#]]} &,
  Flatten[ImageData[img], 1]
  ]]

Mathematica graphics

ImageHistogram

If you have a colour image, such as

img = ImageResize[ExampleData[{"TestImage", "Apples"}], 100]

Mathematica graphics

As mentioned by JM, there is ImageHistogram

ImageHistogram[img]

Mathematica graphics

Dimensions

But for some reason you have NOT explained, you want to use Histogram3D, which takes arguments in the form of list of pairs of values.

Then the number of colour channels is 3

ImageChannels[img]

That implies that the dimensions of the data array, is the dimensions of the pixel array and depth 3.

Dimensions[ImageData[img]]
(* {67, 100, 3} *)

So the data is incompatible.

Re-arrange

Of course you could rearrange the data.

Partition[Flatten[ImageData[img]], 2]

or

ArrayReshape[
 ImageData[img]
 , {Times @@ Dimensions[ImageData[img]]/2, 2}
 ]

but then you are mixing the RGB values and

{{r[1], g[1], b[1]}, {r[2], g[2], b[2]}, {r[3], g[3], b[3]}, {r[4], 
  g[4], b[4]}, {r[5], g[5], b[5]}, ... , {r[n], g[n], b[n]}}

becomes

{{r[1], g[1]}, {b[1], r[2]}, {g[2], b[2]}, {r[3], g[3]}, {b[3], 
  r[4]}, ... , {g[n], b[n]}}

Manipulate

you can process or manipulate the data to create some other set, for example averaging two channels

Map[{First[#], Mean[Rest[#]]} &,
 Flatten[ImageData[img], 1]
 ]

you will get something like

{{r[1], (b[1] + g[1])/2}, {r[2], (b[2] + g[2])/2},..., {r[n], (b[n] + g[n])/2}

Histogram3D

Whatever you did, then you can apply the Histogram3D to the array woth dimensions {n,2}

Dimensions@Map[{First[#], Mean[Rest[#]]} &,
  Flatten[ImageData[img], 1]
  ]
(* {6700, 2} *)

Histogram3D[
 Map[{First[#], Mean[Rest[#]]} &,
  Flatten[ImageData[img], 1]
  ]]

Mathematica graphics

added 315 characters in body
Source Link
rhermans
  • 37.4k
  • 4
  • 61
  • 152

ImageHistogram

If you have a colour image, such as

img = ImageResize[ExampleData[{"TestImage", "Apples"}], 100]

Mathematica graphics

As mentioned by JM, there is ImageHistogram

ImageHistogram[img]

Mathematica graphics

Dimensions

But for some reason you have NOT explained, you want to use Histogram3D, which takes arguments in the form of list of pairs of values.

Then the number of colour channels is 3

ImageChannels[img]

That implies that the dimensions of the data array, is the dimensions of the pixel array and depth 3.

Dimensions[ImageData[img]]
(* {67, 100, 3} *)

So the data is incompatible.

Re-arrange

Of course you could rearrange the data.

Partition[Flatten[ImageData[img]], 2]

or

ArrayReshape[
 ImageData[img]
 , {Times @@ Dimensions[ImageData[img]]/2, 2}
 ]

but then you are mixing the RGB values and

{{r[1], g[1], b[1]}, {r[2], g[2], b[2]}, {r[3], g[3], b[3]}, {r[4], 
  g[4], b[4]}, {r[5], g[5], b[5]}, ... , {r[n], g[n], b[n]}}

becomes

{{r[1], g[1]}, {b[1], r[2]}, {g[2], b[2]}, {r[3], g[3]}, {b[3], 
  r[4]}, ... , {g[n], b[n]}}

Manipulate

you can process or manipulate the data to create some other set, for example averaging two channels

Map[{First[#], Mean[Rest[#]]} &,
 Flatten[ImageData[img], 1]
 ]

Histogram3D

Whatever you did, then you can apply the Histogram3D to the array woth dimensions {n,2}

Dimensions@Map[{First[#], Mean[Rest[#]]} &,
  Flatten[ImageData[img], 1]
  ]
(* {6700, 2} *)

Histogram3D[
 Map[{First[#], Mean[Rest[#]]} &,
  Flatten[ImageData[img], 1]
  ]]

Mathematica graphics

If you have a colour image, such as

img = ImageResize[ExampleData[{"TestImage", "Apples"}], 100]

Mathematica graphics

As mentioned by JM, there is ImageHistogram

ImageHistogram[img]

Mathematica graphics

But for some reason you have NOT explained, you want to use Histogram3D, which takes arguments in the form of list of pairs of values.

Then the number of colour channels is 3

ImageChannels[img]

That implies that the dimensions of the data array, is the dimensions of the pixel array and depth 3.

Dimensions[ImageData[img]]
(* {67, 100, 3} *)

So the data is incompatible.

Of course you could rearrange the data.

Partition[Flatten[ImageData[img]], 2]

or

ArrayReshape[
 ImageData[img]
 , {Times @@ Dimensions[ImageData[img]]/2, 2}
 ]

but then you are mixing the RGB values and

{{r[1], g[1], b[1]}, {r[2], g[2], b[2]}, {r[3], g[3], b[3]}, {r[4], 
  g[4], b[4]}, {r[5], g[5], b[5]}, ... , {r[n], g[n], b[n]}}

becomes

{{r[1], g[1]}, {b[1], r[2]}, {g[2], b[2]}, {r[3], g[3]}, {b[3], 
  r[4]}, ... , {g[n], b[n]}}

ImageHistogram

If you have a colour image, such as

img = ImageResize[ExampleData[{"TestImage", "Apples"}], 100]

Mathematica graphics

As mentioned by JM, there is ImageHistogram

ImageHistogram[img]

Mathematica graphics

Dimensions

But for some reason you have NOT explained, you want to use Histogram3D, which takes arguments in the form of list of pairs of values.

Then the number of colour channels is 3

ImageChannels[img]

That implies that the dimensions of the data array, is the dimensions of the pixel array and depth 3.

Dimensions[ImageData[img]]
(* {67, 100, 3} *)

So the data is incompatible.

Re-arrange

Of course you could rearrange the data.

Partition[Flatten[ImageData[img]], 2]

or

ArrayReshape[
 ImageData[img]
 , {Times @@ Dimensions[ImageData[img]]/2, 2}
 ]

but then you are mixing the RGB values and

{{r[1], g[1], b[1]}, {r[2], g[2], b[2]}, {r[3], g[3], b[3]}, {r[4], 
  g[4], b[4]}, {r[5], g[5], b[5]}, ... , {r[n], g[n], b[n]}}

becomes

{{r[1], g[1]}, {b[1], r[2]}, {g[2], b[2]}, {r[3], g[3]}, {b[3], 
  r[4]}, ... , {g[n], b[n]}}

Manipulate

you can process or manipulate the data to create some other set, for example averaging two channels

Map[{First[#], Mean[Rest[#]]} &,
 Flatten[ImageData[img], 1]
 ]

Histogram3D

Whatever you did, then you can apply the Histogram3D to the array woth dimensions {n,2}

Dimensions@Map[{First[#], Mean[Rest[#]]} &,
  Flatten[ImageData[img], 1]
  ]
(* {6700, 2} *)

Histogram3D[
 Map[{First[#], Mean[Rest[#]]} &,
  Flatten[ImageData[img], 1]
  ]]

Mathematica graphics

Source Link
rhermans
  • 37.4k
  • 4
  • 61
  • 152

If you have a colour image, such as

img = ImageResize[ExampleData[{"TestImage", "Apples"}], 100]

Mathematica graphics

As mentioned by JM, there is ImageHistogram

ImageHistogram[img]

Mathematica graphics

But for some reason you have NOT explained, you want to use Histogram3D, which takes arguments in the form of list of pairs of values.

Then the number of colour channels is 3

ImageChannels[img]

That implies that the dimensions of the data array, is the dimensions of the pixel array and depth 3.

Dimensions[ImageData[img]]
(* {67, 100, 3} *)

So the data is incompatible.

Of course you could rearrange the data.

Partition[Flatten[ImageData[img]], 2]

or

ArrayReshape[
 ImageData[img]
 , {Times @@ Dimensions[ImageData[img]]/2, 2}
 ]

but then you are mixing the RGB values and

{{r[1], g[1], b[1]}, {r[2], g[2], b[2]}, {r[3], g[3], b[3]}, {r[4], 
  g[4], b[4]}, {r[5], g[5], b[5]}, ... , {r[n], g[n], b[n]}}

becomes

{{r[1], g[1]}, {b[1], r[2]}, {g[2], b[2]}, {r[3], g[3]}, {b[3], 
  r[4]}, ... , {g[n], b[n]}}