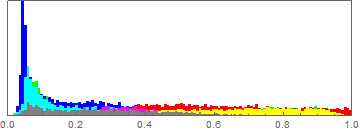
If you have a colour image, such as
img = ImageResize[ExampleData[{"TestImage", "Apples"}], 100]

As mentioned by JM, there is [`ImageHistogram`](http://reference.wolfram.com/language/ref/ImageHistogram.html)
ImageHistogram[img]

But for some reason you have NOT explained, you want to use [`Histogram3D`](http://reference.wolfram.com/language/ref/Histogram3D.html), which takes arguments in the form of list of pairs of values.
Then the number of colour channels is 3
ImageChannels[img]
That implies that the dimensions of the data array, is the dimensions of the pixel array and depth 3.
Dimensions[ImageData[img]]
(* {67, 100, 3} *)
So the data is incompatible.
Of course you could rearrange the data.
Partition[Flatten[ImageData[img]], 2]
or
ArrayReshape[
ImageData[img]
, {Times @@ Dimensions[ImageData[img]]/2, 2}
]
but then you are mixing the RGB values and
{{r[1], g[1], b[1]}, {r[2], g[2], b[2]}, {r[3], g[3], b[3]}, {r[4],
g[4], b[4]}, {r[5], g[5], b[5]}, ... , {r[n], g[n], b[n]}}
becomes
{{r[1], g[1]}, {b[1], r[2]}, {g[2], b[2]}, {r[3], g[3]}, {b[3],
r[4]}, ... , {g[n], b[n]}}