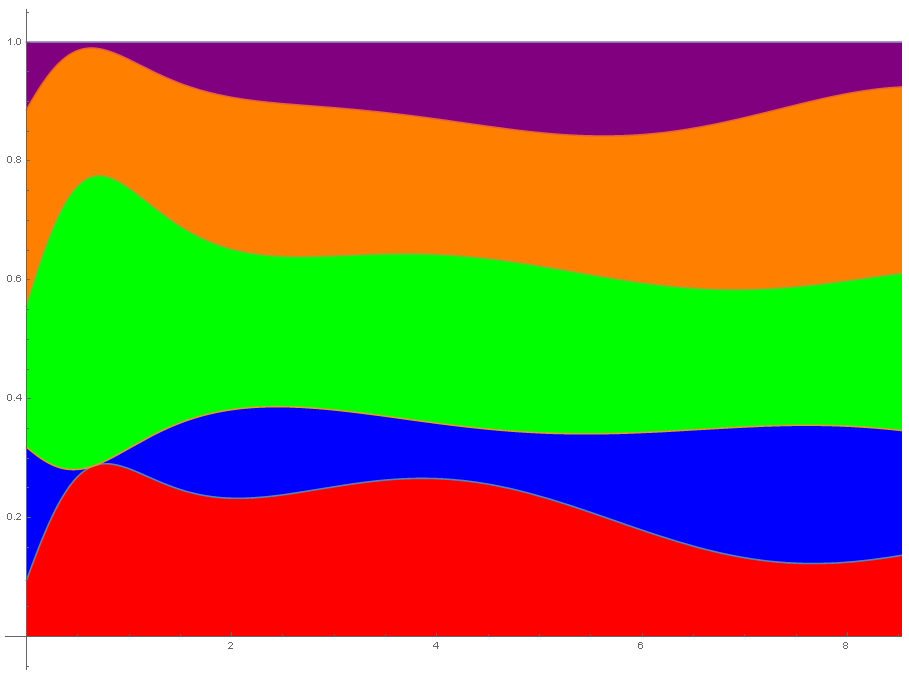
I know you can plot percentages using stacked histograms like this:
data = RandomReal[1, {10, 5}];
BarChart[#/Plus @@ # & /@ data, ChartLayout -> "Stacked"]
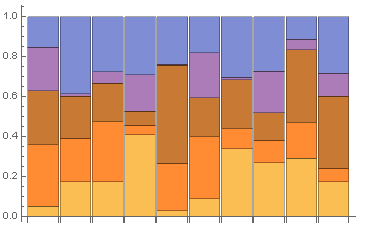
But what if I'm plotting continuous functions?
I would like to plot those like this: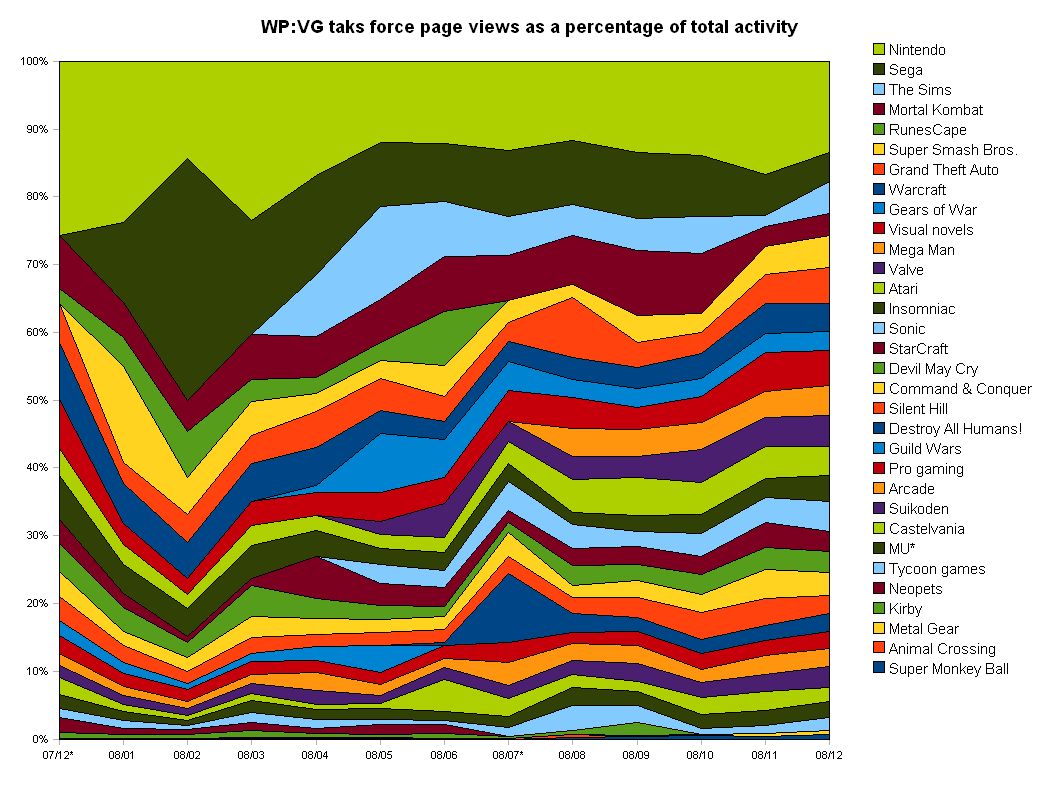
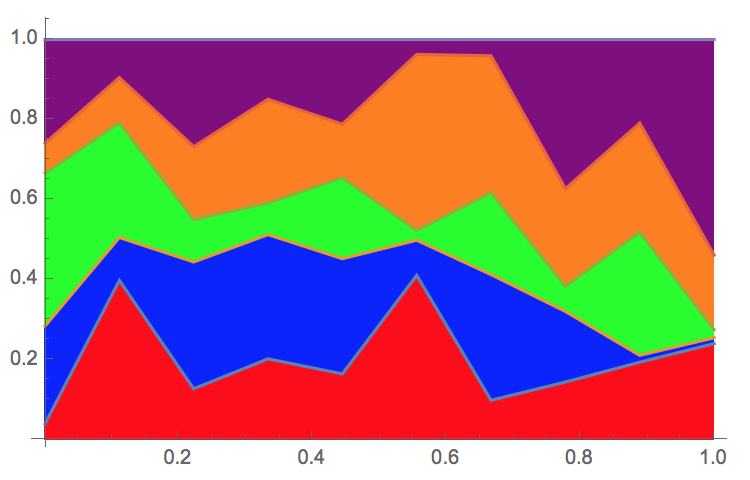
Here is another approach:
data = RandomReal[1, {10, 5}];
dataNorm=Accumulate@Normalize[#,Total]&/@ data;
setLength=Length@data[[1]];
colors = <|1->Red,2->Blue,3->Green,4->Orange,5->Purple|>;

ListPlot[Transpose@dataNorm
        ,Joined->True
        ,Filling -> Table[i -> {{i-1}/.{0}-> 0, colors[i]} ,{i,setLength}]
        ,DataRange-> {0,1}
]
Update
Code with PlotLegends, generic number of lines and using InterpolationOrder to get a nice wave effect.
data = RandomReal[1, {10, 30}];
dataNorm=Accumulate@Normalize[#,Total]&/@ data;
setLength=Length@data[[1]];
colorList={Red,Green,Blue,Orange,Yellow};
colors=Association@MapIndexed[First@#2-> #1&,PadLeft[colorList,setLength,colorList]];

ListLinePlot[Transpose@dataNorm
        ,Joined->True
        ,Filling -> Table[i -> {{i-1}/.{0}-> 0, colors[i]} ,{i,setLength}]

        ,DataRange-> {0,1}
        ,PlotStyle->None
        ,InterpolationOrder->2
        ,PlotLegends->Normal@colors
]
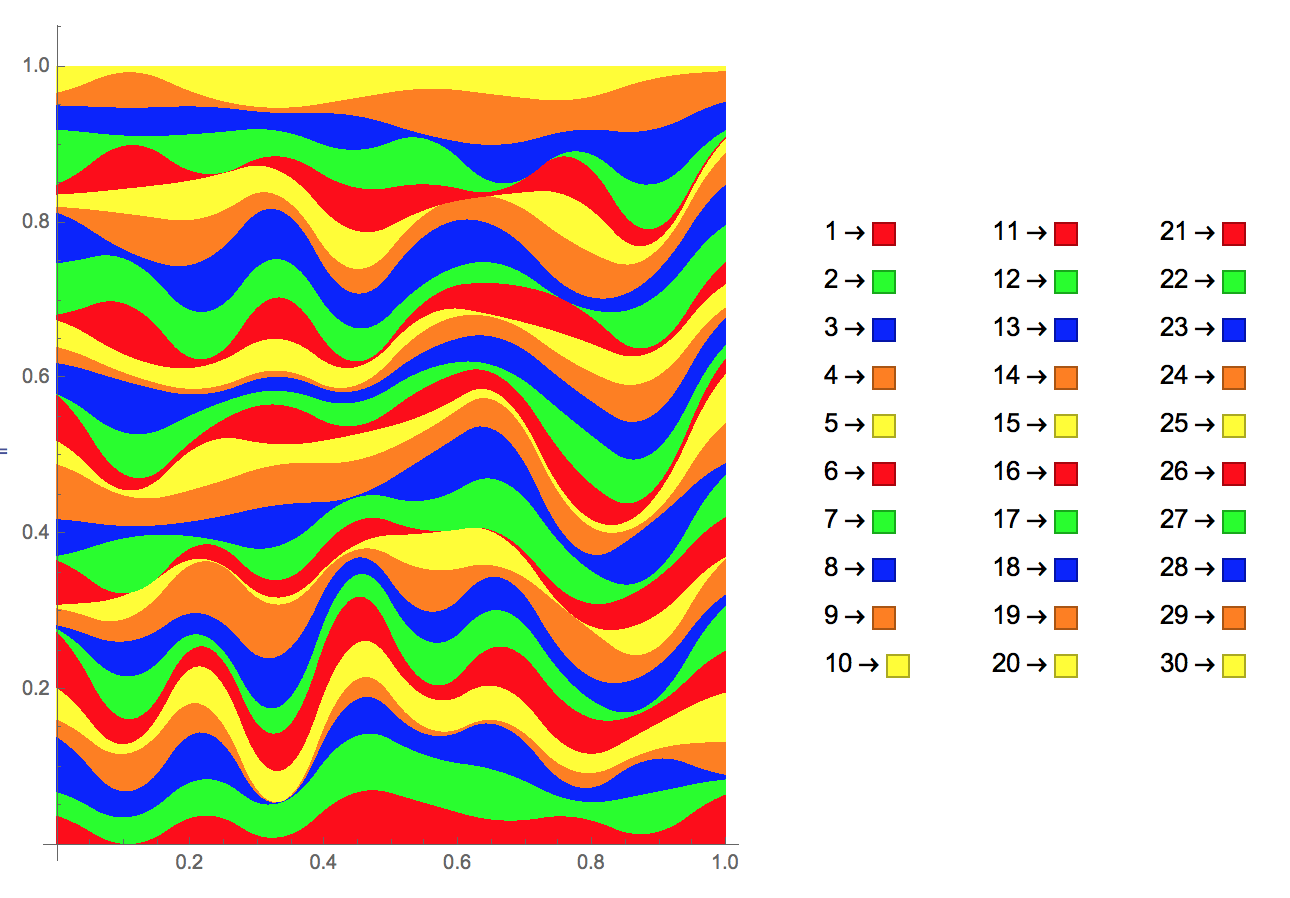
Update: In versions 11.2+, you can use StackedDateListPlot, StackedListPlot and PlotLayout to get the desired output:
data = Accumulate/@RandomReal[1, {10, 30}];
StackedDateListPlot[data, {2010, 1}, PlotLayout -> "Percentile"]
DateListPlot[data, {2010, 1}, PlotLayout -> "Percentile", Filling -> Automatic]
StackedListPlot[data, PlotLayout->"Percentile"]
ListLinePlot[data, PlotLayout -> "Percentile", Filling -> Automatic]
Original answer: FWIW
Perhaps something like:
fakedata = Table[RandomVariate[NormalDistribution[i + RandomReal[{-1, 1}], 5], 100],
  {i, 2, 25}];

colors = {Red, Blue, Green, Orange, Purple};
quantiles = {.05, .1, .5, .9, .95};
dists = SmoothKernelDistribution /@ fakedata;

qdata = Transpose[Outer[Quantile, dists, quantiles]];
ListPlot[qdata, Joined -> True, DataRange -> {2, 25},
 BaseStyle -> Thick, InterpolationOrder -> 2,
 Filling -> Join[# + 1 -> {{#}, colors[[# + 1]]} & /@ Range[4], {1 -> {Bottom, Red}}],
 PlotStyle -> colors, PlotLegends -> LineLegend[quantiles]]
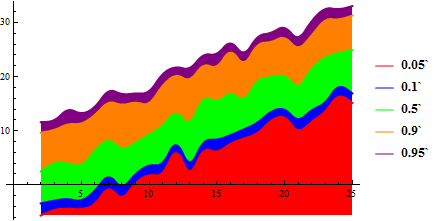
Inspired by Murta's answer, here is a similar smooth plot:
randomPolynoms =
 Table[Fit[MapIndexed[{#2[[1]] - 1, #1/2} &, RandomReal[1, 21]],
   Table[x^i, {i, 0, 10}], x], {i, 1, 5}];
randomFunctions = (# + Abs[MinValue[{#, 0 <= x <= 10}, x]]) & /@
  randomPolynoms;
dataNorm = Accumulate@Normalize[randomFunctions, Total];
setLength = Length@randomFunctions;
colors = <|1 -> Red, 2 -> Blue, 3 -> Green, 4 -> Orange, 5 -> Purple|>;
Plot[dataNorm, {x, 0, 10},
 Filling ->
  Table[i -> {{i - 1} /. {0} -> 0, colors[i]}, {i, setLength}]]
