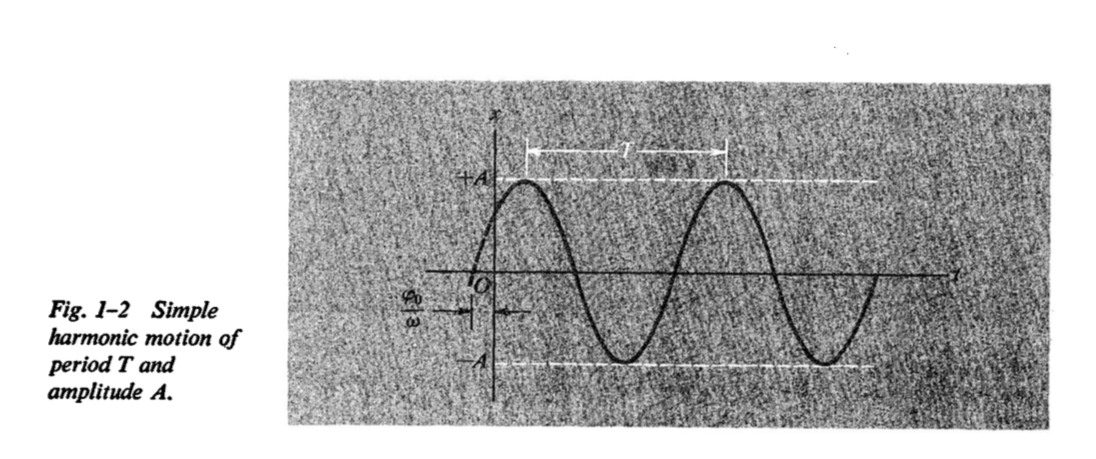
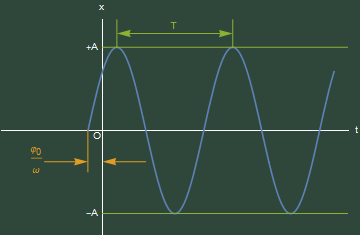
Hello i would like to recreate the image i am showing. I can plot the wave equation and i can add the dashed lines for plus minus A. Is there an easy way to add the "tags" to show what what A, phi, omega, etc mean? I want to create this picture to add it to a tex file so if you know a better alternative to create it using mathematica i would appreciate the information.
$\begingroup$
$\endgroup$
4
-
$\begingroup$ That screenshot looks ghastly. Would you mind mentioning the textbook/paper you got this figure from, so that people with copies of those references can look it up themselves? $\endgroup$– J. M.'s missing motivation ♦Commented Mar 15, 2018 at 5:56
-
$\begingroup$ I suggest you look at the Draw Tools in the Graphics Menu to finalize any plot in a quite professional way if you do not want use MMA functions. $\endgroup$– José Antonio Díaz NavasCommented Mar 15, 2018 at 10:36
-
$\begingroup$ @J.M. I took it from the book "Vibrations and waves" from A.P French. $\endgroup$– blidtCommented Mar 15, 2018 at 17:50
-
$\begingroup$ @JoséAntonioDíazNavas I am not familiar with the graphics menu but i'll look into it, thanks. $\endgroup$– blidtCommented Mar 15, 2018 at 17:52
Add a comment
|
1 Answer
$\begingroup$
$\endgroup$
1
I'll leave this as a starting point for others to improve on:
With[{A = 1, f = 1, h = π/4},
     Plot[A Sin[2 π f t + h], {t, -h/(2 π f), 2},
          AxesLabel -> {"t", "x"}, AxesOrigin -> {0, 0}, AxesStyle -> White,
          Background -> ColorData["Legacy", "LampBlack"], BaseStyle -> White,
          Epilog -> {{Directive[AbsoluteThickness[1], ColorData[97, 3]],
                      HalfLine[{0, A}, {1, 0}], HalfLine[{0, -A}, {1, 0}],
                      Line[{{(π - 2 h)/(4 f π), A}, {(π - 2 h)/(4 f π), 4/3 A}}],
                      Line[{{(5 π - 2 h)/(4 f π), A}, {(5 π - 2 h)/(4 f π), 4/3 A}}],
                      Arrowheads[{{-0.04, 0}, {Automatic, 1/2,
                                   Graphics[Text["T", {0, 0}, {0, -1}]]}, {0.04, 1}}],
                      Arrow[{{(π - 2 h)/(4 f π), 7/6 A},
                             {(5 π - 2 h)/(4 f π), 7/6 A}}]},
                     {Directive[AbsoluteThickness[1], ColorData[97, 2]],
                      Line[{{-h/(2 π f), 0}, {-h/(2 π f), -A/2}}],
                      Arrowheads[0.04],
                      Arrow[{{3 h/(2 π f), -3 A/8}, {0, -3 A/8}}],
                      Arrow[{{-4 h/(2 π f), -3 A/8}, {-h/(2 π f), -3 A/8}}],
                      Text[TraditionalForm[Subscript[ϕ, 0]/ω],
                           {-4 h/(2 π f), -3 A/8}, {1, 0}]},
                     Text["O", {0, 0}, {1, 1}]}, Method -> {"AxesInFront" -> False},
          PlotRange -> {{-7 h/(2 π f), 2 + 1/8}, {-5/4 A, 4/3 A}},
          Ticks -> {None, {{-A, "-A"}, {A, "+A"}}}]]


