0
$\begingroup$

This is my first time here, so let me know if there's something I need to add to the post etc. Anyway, I need some help with Mathematica and linear algebra, and I got some tips that this would be the right place to come for help.

I've got two bases, and a vector called x.

(V) First Base: {{1,3}, {4,6}}
(W) Second Base: {{4,6}, {2,5}}
Vector x: {6,6} 

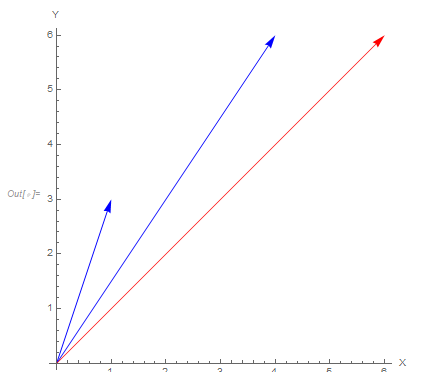
I started out by plotting the two base-vectors in the V-base and the vector x in the same picture. I then did the same thing with the W-base and the x vector.

I've plotted two graps, but I'll only post a picture of the first one initially. This is what the first plot looked like (for reference):

enter image description here

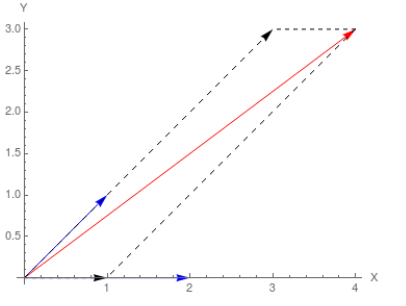
Now, here's what I need help with. I'm supposed to solve the system of equations in Mathematica, to find V-coordinates for x and W-coordinates for x, and then plot the components for x in each coordinate-system, using (Dashed, Line).

This graph was posted as an example on how it should look like. enter image description here
$\endgroup$
2
  • $\begingroup$ What have you tried so far? Have a look at LinearSolve and related functions. $\endgroup$
    – Lukas Lang
    Commented Jan 2, 2019 at 15:47
  • $\begingroup$ Honestly, I haven't been able to do anything with it. I've been sitting all day with different exercises, and I haven't gotten anywhere with this one. That's why I figured I needed a good explanation.. $\endgroup$
    – J.Doe
    Commented Jan 2, 2019 at 16:04

1 Answer 1

1
$\begingroup$

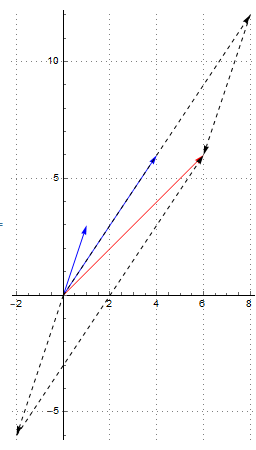
Here is one solution:

V = {{1, 3}, {4, 6}};

x = {6, 6};

vx = LinearSolve[Transpose@V, x]
(* { -2, 2 } *)

vector[x0_: {0, 0}, v_] := Arrow@{x0, x0 + v}

Graphics[
 {
  Blue,
  vector /@ V,
  Red,
  vector@x,
  Black,
  Dashed,
  vector /@ (vx V),
  MapThread[vector, {vx V, Reverse[vx V]}]
  },
 Axes -> True,
 AxesStyle -> Black,
 GridLines -> Automatic,
 GridLinesStyle -> Directive[Gray, Dotted]
 ]

enter image description here

$\endgroup$
4
  • $\begingroup$ So if I wanted to do this with the W-base aswell, I'd replace V? Also, should it be going into the negative parts of the graph? $\endgroup$
    – J.Doe
    Commented Jan 2, 2019 at 16:35
  • $\begingroup$ Why should it not go to negative coordinates? And yes, replacing all occurrences of V with W will do the same for the W base. But I'd suggest you try to understand what the code does in detail instead of just applying it - if you have questions about a specific line, feel free to ask $\endgroup$
    – Lukas Lang
    Commented Jan 2, 2019 at 16:41
  • $\begingroup$ It just confused me since the example didn't show it, but I understand that my values aren't the same which means that the graph will look differently. Nevermidn that then. What I'm wondering however, is what the 4th line does. Bear in mind, I'm pretty new to Mathematica generally speaking, so I'm not familiar with what the functions in the line does. $\endgroup$
    – J.Doe
    Commented Jan 2, 2019 at 17:27
  • $\begingroup$ The vector function is a helper function that returns an Arrow directive that represents a vector starting at x0 and being v long (i.e. it ends at x0+v). The :{0,0} just means that if we only give one parameter to vector, x0 should take a default value of {0,0}. So vector[{2,2}] will return Arrow[{{0,0},{2,2}}], which is a vector starting at the origin and ending at {2,2}. $\endgroup$
    – Lukas Lang
    Commented Jan 2, 2019 at 18:59

Your Answer

By clicking “Post Your Answer”, you agree to our terms of service and acknowledge you have read our privacy policy.

Not the answer you're looking for? Browse other questions tagged or ask your own question.