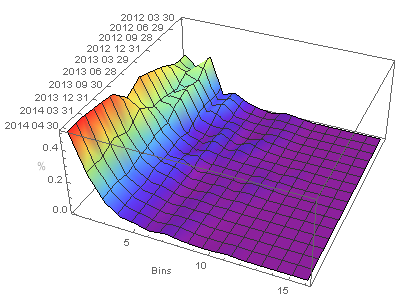
I'm trying to create an Excel like surface plot from an import of data from an Excel workbook. I get the data without issue. It is a set of percentages in bin ranges over a series of dates. I'd like to plot this as a surface. After some searching it appears that I need to use ListContorPlot3D.
It seems that I need to transform the data into a list of 3d vectors. I want the dates to show in the plot so I use the DateObject to let the plot know what it is. However, it wont plot. It complains that I have not provided a list of points of dimension 3. But it is a list of points of dimension 3; {Date, Bin, Value}.
I thought this would be an easy thing to do with the import. What have I done wrong? Am I using the correct plot for this? A sample of the data, the transformation command, and the plot command is below.
Many thanks for your help.
Edmund
testData = {{{2014, 4, 30, 0, 0, 0.`}, 0.5037593984962406`,
0.2631578947368421`, 0.11278195488721804`, 0.045112781954887216`,
0.03007518796992481`, 0.007518796992481203`,
0.022556390977443608`, 0.007518796992481203`, 0.`, 0.`,
0.007518796992481203`, 0.`, 0.`, 0.`, 0.`,
0.`}, {{2014, 3, 31, 0, 0, 0.`}, 0.5072463768115942`,
0.2536231884057971`, 0.12318840579710146`, 0.050724637681159424`,
0.028985507246376812`, 0.007246376811594203`,
0.014492753623188406`, 0.014492753623188406`, 0.`, 0.`, 0.`, 0.`,
0.`, 0.`, 0.`, 0.`}, {{2013, 12, 31, 0, 0, 0.`},
0.49295774647887325`, 0.29577464788732394`, 0.09859154929577464`,
0.04225352112676056`, 0.035211267605633804`,
0.007042253521126761`, 0.014084507042253521`,
0.007042253521126761`, 0.007042253521126761`, 0.`, 0.`, 0.`, 0.`,
0.`, 0.`, 0.`}, {{2013, 9, 30, 0, 0, 0.`}, 0.4765625`, 0.25`,
0.125`, 0.0703125`, 0.046875`, 0.0078125`, 0.`, 0.015625`, 0.`,
0.0078125`, 0.`, 0.`, 0.`, 0.`, 0.`,
0.`}, {{2013, 6, 28, 0, 0, 0.`}, 0.3761467889908257`,
0.3211009174311927`, 0.14678899082568808`, 0.05504587155963303`,
0.05504587155963303`, 0.`, 0.009174311926605505`,
0.009174311926605505`, 0.`, 0.01834862385321101`,
0.009174311926605505`, 0.`, 0.`, 0.`, 0.`,
0.`}, {{2013, 3, 29, 0, 0, 0.`}, 0.42857142857142855`,
0.24761904761904763`, 0.14285714285714285`, 0.06666666666666667`,
0.01904761904761905`, 0.0380952380952381`, 0.01904761904761905`,
0.009523809523809525`, 0.009523809523809525`,
0.009523809523809525`, 0.`, 0.009523809523809525`, 0.`, 0.`, 0.`,
0.`}, {{2012, 12, 31, 0, 0, 0.`}, 0.39`, 0.23`, 0.22`, 0.03`,
0.01`, 0.06`, 0.01`, 0.04`, 0.01`, 0.`, 0.`, 0.`, 0.`, 0.`, 0.`,
0.`}, {{2012, 9, 28, 0, 0, 0.`}, 0.3473684210526316`, 0.2`,
0.25263157894736843`, 0.07368421052631578`, 0.042105263157894736`,
 0.042105263157894736`, 0.010526315789473684`, 0.`,
0.021052631578947368`, 0.010526315789473684`, 0.`, 0.`, 0.`, 0.`,
0.`, 0.`}, {{2012, 6, 29, 0, 0, 0.`}, 0.28888888888888886`,
0.25555555555555554`, 0.2222222222222222`, 0.06666666666666667`,
0.1`, 0.022222222222222223`, 0.011111111111111112`,
0.011111111111111112`, 0.011111111111111112`,
0.011111111111111112`, 0.`, 0.`, 0.`, 0.`, 0.`,
0.`}, {{2012, 3, 30, 0, 0, 0.`}, 0.27906976744186046`,
0.19767441860465115`, 0.3023255813953488`, 0.05813953488372093`,
0.08139534883720931`, 0.03488372093023256`, 0.011627906976744186`,
 0.`, 0.023255813953488372`, 0.011627906976744186`, 0.`, 0.`, 0.`,
 0.`, 0.`, 0.`}};

plotData = Flatten[Table[{DateObject[testData[[x, 1]],
 DateFormat -> {"Year", "Month", "Day"}], y - 1,
 testData[[x, y]]}, {x, Dimensions[testData, 1][[1]]}, {y, 2,
 Dimensions[testData, 2][[2]]}], 1];

ListContourPlot3D[plotData, Contours -> 1,
 AxesOrigin -> {DateObject[{2014, 4, 30, 0, 0, 0.`}], 0, 0},
 AxesLabel -> {"Date", "Bins", "%"}]

