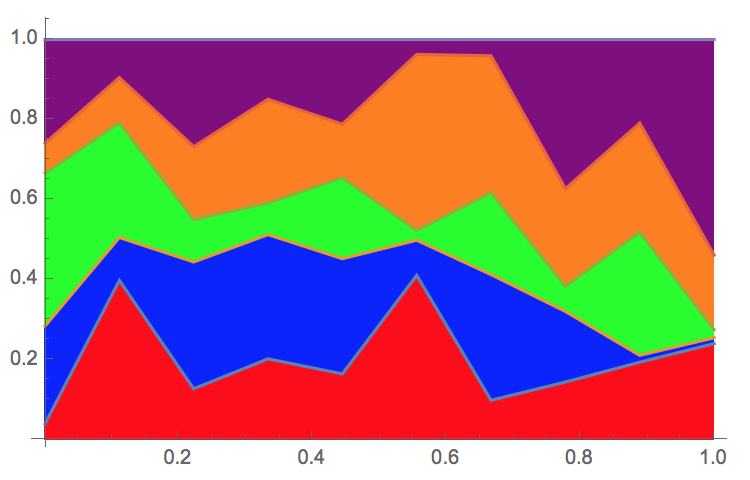
Here is another approach:
data = RandomReal[1, {10, 5}];
dataNorm=Accumulate@Normalize[#,Total]&/@ data;
setLength=Length@data[[1]];
colors = <|1->Red,2->Blue,3->Green,4->Orange,5->Purple|>;

ListPlot[Transpose@dataNorm
        ,Joined->True
        ,Filling -> Table[i -> {{i-1}/.{0}-> 0, colors[i]} ,{i,setLength}]
        ,DataRange-> {0,1}
]


Update
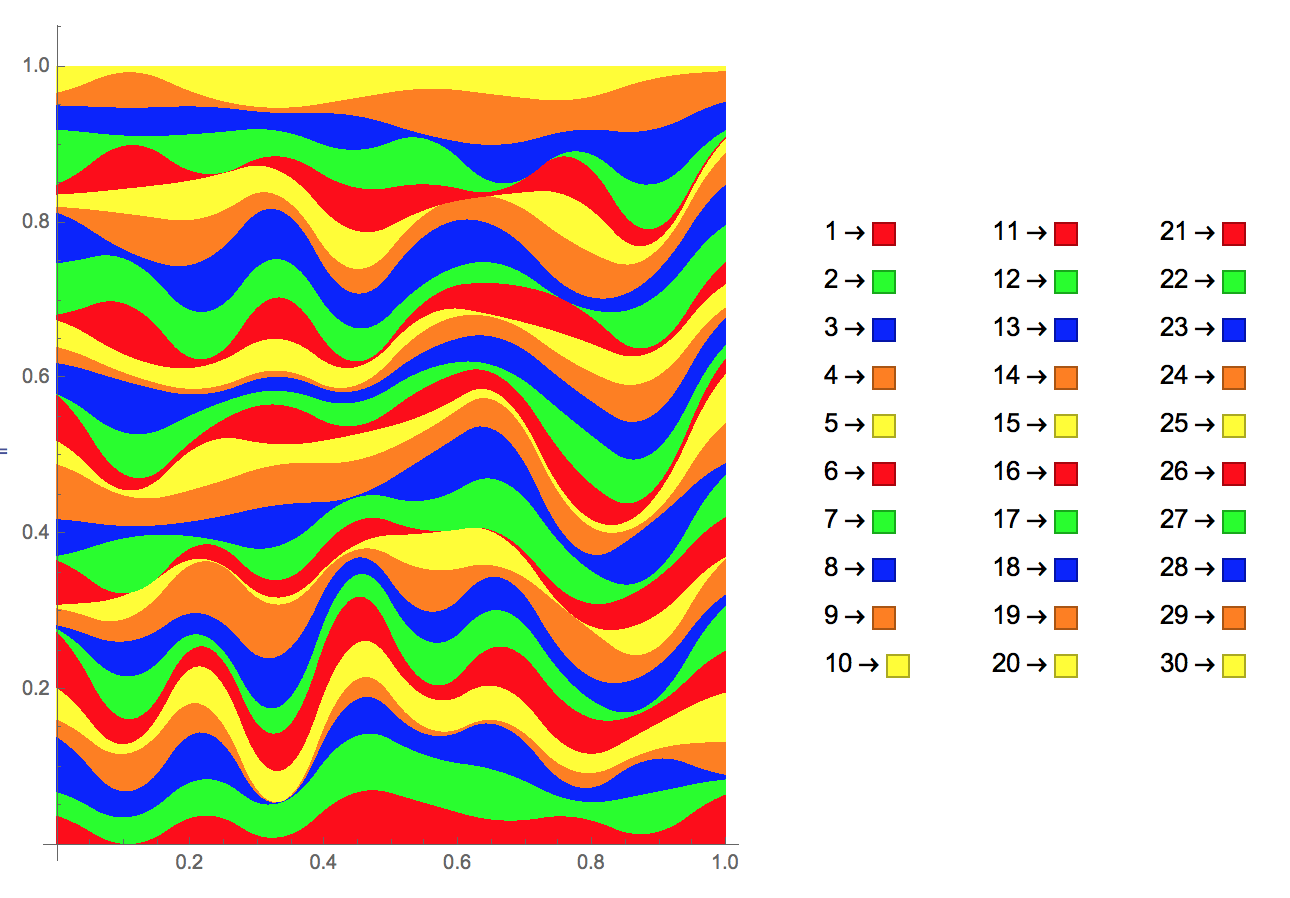
Code with PlotLegends, generic number of lines and using InterpolationOrder to get a nice wave effect.
data = RandomReal[1, {10, 30}];
dataNorm=Accumulate@Normalize[#,Total]&/@ data;
setLength=Length@data[[1]];
colorList={Red,Green,Blue,Orange,Yellow};
colors=Association@MapIndexed[First@#2-> #1&,PadLeft[colorList,setLength,colorList]];

ListLinePlot[Transpose@dataNorm
        ,Joined->True
        ,Filling -> Table[i -> {{i-1}/.{0}-> 0, colors[i]} ,{i,setLength}]

        ,DataRange-> {0,1}
        ,PlotStyle->None
        ,InterpolationOrder->2
        ,PlotLegends->Normal@colors
]

