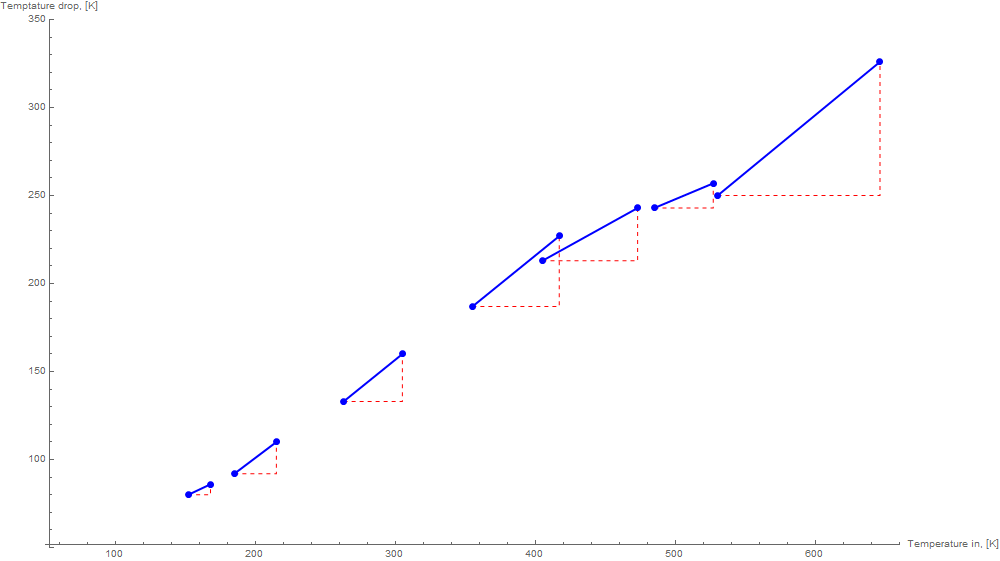
For 7 different discharge energies, I have two gases (1. pure helium, 2. a helium oxygen mixture) being heated up. Those 14 settings then enter a tube, in which the system cools off. In the list below, the first "HePure" pair {152,72} says the gas enters the tube at 152 kelvins and comes out at 72 kelvins. At the same discharge energy input, the oxygen mixture generally takes more energy, so the first "HeO2Mix" pair is hotter (186 vs. 151 kelvins), but the temperature drop is again about 80 kelvins (152-72=80 vs. 168-82=86 kelvins).
I draw a nice picture. The two curves overlap, which shows that even if the heating is different for the two systems, the temperature drop in the tube only depends on the temperature when the gases enter, not on the chemical composition.
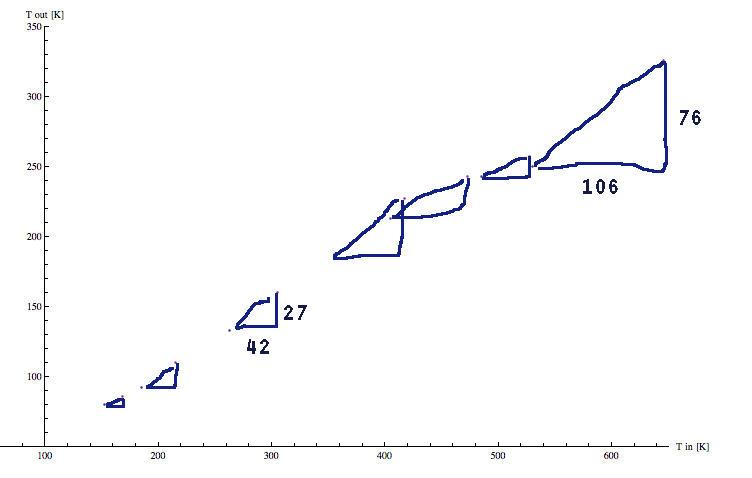
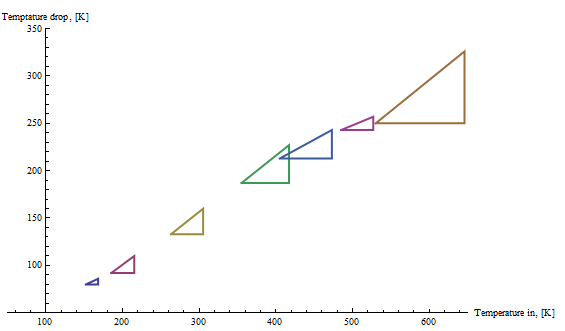
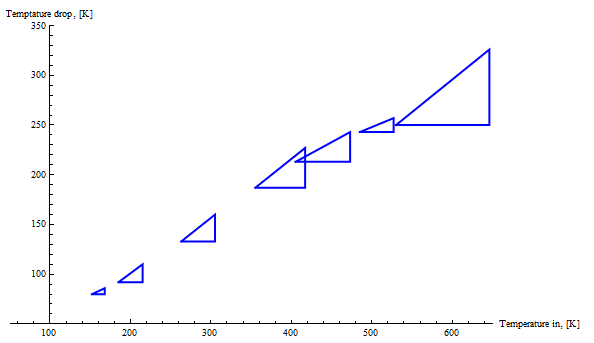
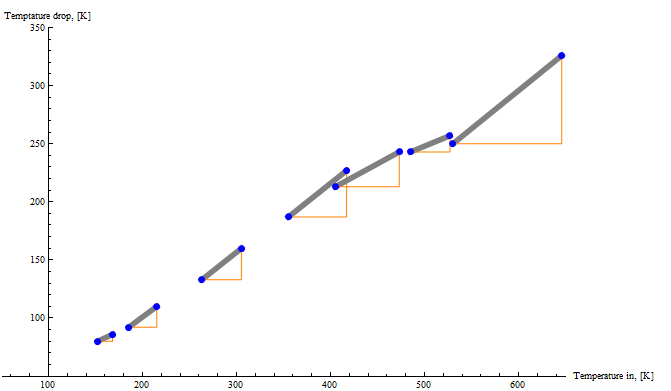
However, to simultaneously show the initial heating for the 7 respective input energies, I'd like for the 7 corresponding pairs to be connected. So there should be a line between {152, 72} and {168, 82}, and then between {185, 93} and {215, 105} and so on up to {530, 280} and {646, 320}. At best, I'd like to see all information like in the picture below, with triangles and labels. How is this possible to do?
HePure  = {{152, 72}, {185, 93   }, {263, 130}, {355, 168}, {405, 192}, {485, 242}, {530, 280}};
HeO2Mix = {{168, 82}, {215, 105}, {305, 145}, {417, 190}, {473, 230}, {527, 270}, {646, 320}};

tempDrop = {#[[1]], #[[1]] - #[[2]]} &;

ListPlot[ {tempDrop /@ HePure, tempDrop /@ HeO2Mix}, PlotRange -> {{50, 650}, {50, 350}}, AxesLabel -> {"Temperature in, [K]", "Temperature drop, [K]"}]
