Updated: I have two lists (of different lengths) of co-ordinates, in the form {x,y,"tag"}, that I wish to plot so that one list is graphically linked to the other list via their tags. In other words, I want to show the parent-daughter relationships between two datasets on a plot. Here is some example code:
parents = {Flatten@{RandomReal[10, 2], "p1" (*parent 1*)},
   Flatten@{RandomReal[10, 2], "p2" (*parent 2*)}}

daughters =
  Partition[
   Flatten@Thread@
     List[Partition[RandomReal[10, 12], 2], {"d1", "d1", "d1", "d2", "d2", "d2"}], 3]

(* d1 corresponds to p1, etc. *)

ListPlot[{parents[[All, 1 ;; 2]], daughters[[All, 1 ;; 2]]},
 PlotMarkers -> {{"\[FilledSquare]", 18}, {"\[FilledDiamond]", 18}},
 AxesOrigin -> {0, 0}]
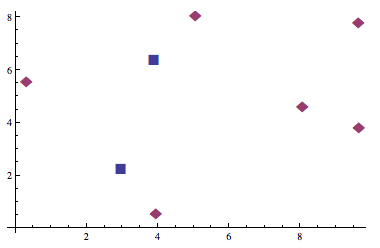
which produces the following:
{{3.89794, 6.38947, "p1"}, {2.97147, 2.27053, "p2"}}

{{5.05879, 8.04477, "d1"}, {3.94848, 0.52971, "d1"}, {0.310406, 5.55621, "d1"},
 {8.058, 4.5872, "d2"}, {9.64885, 3.806, "d2"}, {9.63257, 7.76892, "d2"}}
What I want to end up with is something like this:
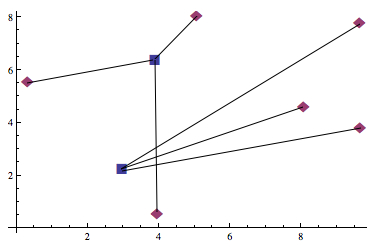
I think this may be achieved with Epilog but I am unsure about how to utilise the 'tags' effectively. Does anyone know how to do this?
Also, the number daughters relative to parents (although consistent in the above example) needs to be variable (e.g. 1 parent - 10 daughters,1 parent - 2 daughters, etc.)
EDIT: Just to clarify/extend the usefulness of what i'm trying to achieve (taking on board what was said by Halirutan and Mr Wizard in their answers), here is an amended example:
parents = {Flatten@{RandomReal[10, 2], "cats" },
  Flatten@{RandomReal[10, 2], "dogs"},
  Flatten@{RandomReal[10, 2], "frogs" }}

children =
 Partition[
  Flatten@Thread@
    List[Partition[RandomReal[10, 18], 2], {"kittens", "kittens",
      "kittens", "puppies", "puppies", "puppies", "tadpoles",
      "tadpoles", "tadpoles"}], 3]
(* kittens corresponds to cats, etc. *)

ListPlot[{parents[[All, 1 ;; 2]], children[[All, 1 ;; 2]]},
 PlotMarkers -> {{"\[FilledSquare]", 18}, {"\[FilledDiamond]", 18}},
 AxesOrigin -> {0, 0}]
The output is essentially the same as above, however, the tags are unique and need to be related to each other explicitly. How do I tell Mathematica that kittens come from cats?
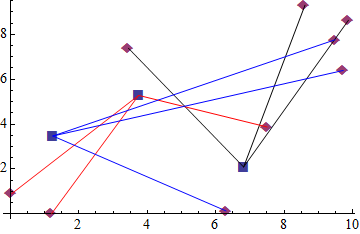
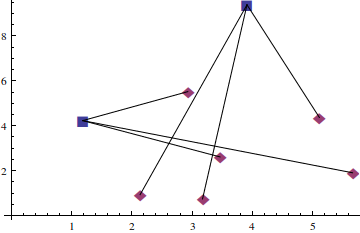
Update2: For those who are interested here is an example of one of the plots created as a result of the answers:
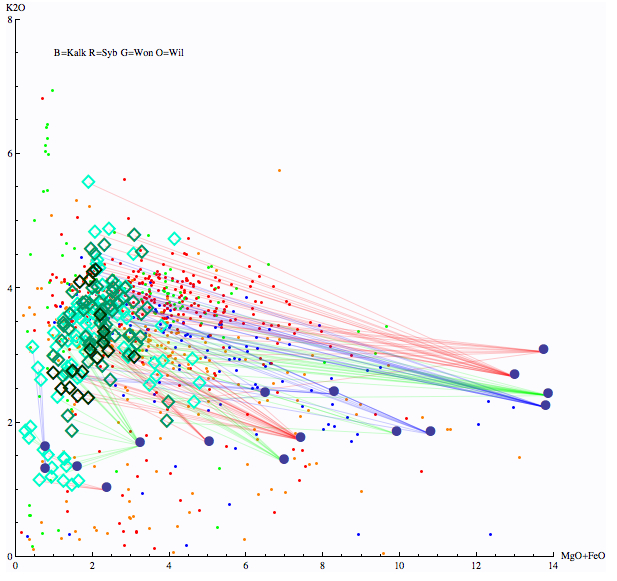
The filled circles are starting compositions (made from various natural and synthetic rocktypes) for melting experiments between 700 - 1100 degC and 1 - 15 kbar. The diamonds are partial melts resulting from the incongruent melting of the starting material. The darker diamonds are low-pressure experiments. The lighter diamonds are high-pressure experiments. The small dots in the background are natural granite compositions for comparison.
A first order observation is that the melts are always less mafic (MgO+FeO) than the starting material (and generally more potassic). One would expect that this phenomena would lead to the formation of more mafic residue if melt is lost from the system.
Thanks again!

