added 10 characters in body
Source Link
kglr
  • 400.5k
  • 18
  • 488
  • 929

You can pre-process the input data to ListPlot

dt = Transpose[{tempDrop /@ HePure, tempDrop /@ HeO2Mix}];
dt2 = Join[#, {Through@{Max, Min}@#, #[[1]]}] & /@ dt;
ListPlot[dt2, Joined -> True, BaseStyle -> Thick]
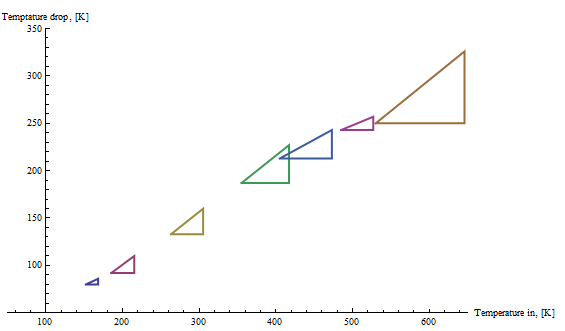
enter image description here

ListPlot[dt2, Joined -> True, PlotStyle -> Directive[Thick, Blue]]
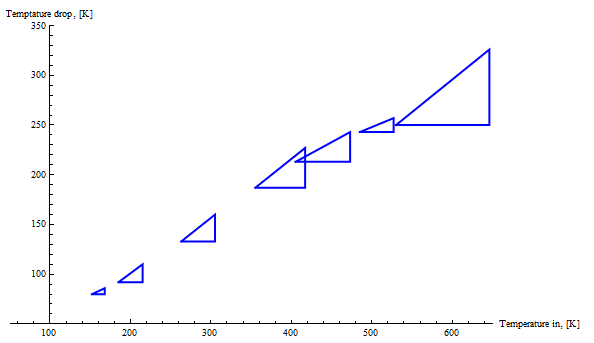
enter image description here

Or, less conveniently, post-process the plot output

lplt1 = ListPlot[dt, PlotRange -> {{50, 650}, {50, 350}}, Joined -> True, 
   AxesLabel -> {"Temperature in, [K]", "Temptature drop, [K]"}, PlotStyle -> Thick] ;
Normal[lplt1] /. Line[x_] :> (Line[Join[x, {Through@{Max, Min}@x, x[[1]]}]])

or

Normal[lplt1] /. Line[x_] :> {Thick, Blue, Line[Join[x, {Through@{Max, Min}@x, x[[1]]}]]}

to get the first and second pictures above.

Update:

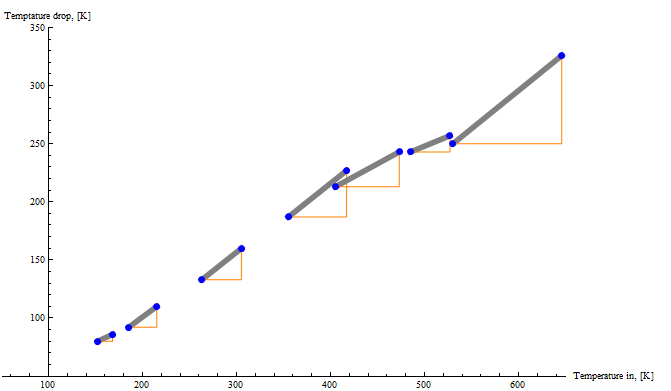
make the artificially added vertical and horizontal part of the triangle ... not thick
(or) to put the dots back on

Normal[lplt1] /. Line[x_] :> {ThickThickness[.01], BlueGray, Line[x], PointSize[Large], Point[x], 
                         Orange, Thin, Line[{x[[1]], Through@{Max, Min}@x, x[[2]]}], 
    PointSize[Large], Blue, Point[x]}

enter image description hereenter image description here

You can pre-process the input data to ListPlot

dt = Transpose[{tempDrop /@ HePure, tempDrop /@ HeO2Mix}];
dt2 = Join[#, {Through@{Max, Min}@#, #[[1]]}] & /@ dt;
ListPlot[dt2, Joined -> True, BaseStyle -> Thick]

enter image description here

ListPlot[dt2, Joined -> True, PlotStyle -> Directive[Thick, Blue]]

enter image description here

Or, less conveniently, post-process the plot output

lplt1 = ListPlot[dt, PlotRange -> {{50, 650}, {50, 350}}, Joined -> True, 
   AxesLabel -> {"Temperature in, [K]", "Temptature drop, [K]"}, PlotStyle -> Thick] ;
Normal[lplt1] /. Line[x_] :> (Line[Join[x, {Through@{Max, Min}@x, x[[1]]}]])

or

Normal[lplt1] /. Line[x_] :> {Thick, Blue, Line[Join[x, {Through@{Max, Min}@x, x[[1]]}]]}

to get the first and second pictures above.

Update:

make the artificially added vertical and horizontal part of the triangle ... not thick
(or) to put the dots back on

Normal[lplt1] /. Line[x_] :> {Thick, Blue, Line[x], PointSize[Large], Point[x], 
                          Thin, Line[{x[[1]], Through@{Max, Min}@x, x[[2]]}]}

enter image description here

You can pre-process the input data to ListPlot

dt = Transpose[{tempDrop /@ HePure, tempDrop /@ HeO2Mix}];
dt2 = Join[#, {Through@{Max, Min}@#, #[[1]]}] & /@ dt;
ListPlot[dt2, Joined -> True, BaseStyle -> Thick]

enter image description here

ListPlot[dt2, Joined -> True, PlotStyle -> Directive[Thick, Blue]]

enter image description here

Or, less conveniently, post-process the plot output

lplt1 = ListPlot[dt, PlotRange -> {{50, 650}, {50, 350}}, Joined -> True, 
   AxesLabel -> {"Temperature in, [K]", "Temptature drop, [K]"}, PlotStyle -> Thick] ;
Normal[lplt1] /. Line[x_] :> (Line[Join[x, {Through@{Max, Min}@x, x[[1]]}]])

or

Normal[lplt1] /. Line[x_] :> {Thick, Blue, Line[Join[x, {Through@{Max, Min}@x, x[[1]]}]]}

to get the first and second pictures above.

Update:

make the artificially added vertical and horizontal part of the triangle ... not thick
(or) to put the dots back on

Normal[lplt1] /. Line[x_] :> {Thickness[.01], Gray, Line[x],
    Orange, Thin, Line[{x[[1]], Through@{Max, Min}@x, x[[2]]}], 
    PointSize[Large], Blue, Point[x]}
enter image description here

added 386 characters in body
Source Link
kglr
  • 400.5k
  • 18
  • 488
  • 929

You can pre-process the input data to ListPlot

dt = Transpose[{tempDrop /@ HePure, tempDrop /@ HeO2Mix}];
dt2 = Join[#, {Through@{Max, Min}@#, #[[1]]}] & /@ dt;
ListPlot[dt2, Joined -> True, BaseStyle -> Thick]

enter image description here

ListPlot[dt2, Joined -> True, PlotStyle -> Directive[Thick, Blue]]

enter image description here

Or, less conveniently, post-process the plot output

lplt1 = ListPlot[dt, PlotRange -> {{50, 650}, {50, 350}}, Joined -> True, 
   AxesLabel -> {"Temperature in, [K]", "Temptature drop, [K]"}, PlotStyle -> Thick] ;
Normal[lplt1] /. Line[x_] :> (Line[Join[x, {Through@{Max, Min}@x, x[[1]]}]])

or

Normal[lplt1] /. Line[x_] :> {Thick, Blue, Line[Join[x, {Through@{Max, Min}@x, x[[1]]}]]}

to get the first and second pictures above.

Update:

make the artificially added vertical and horizontal part of the triangle ... not thick
(or) to put the dots back on

Normal[lplt1] /. Line[x_] :> {Thick, Blue, Line[x], PointSize[Large], Point[x], 
                          Thin, Line[{x[[1]], Through@{Max, Min}@x, x[[2]]}]}

enter image description here

You can pre-process the input data to ListPlot

dt = Transpose[{tempDrop /@ HePure, tempDrop /@ HeO2Mix}];
dt2 = Join[#, {Through@{Max, Min}@#, #[[1]]}] & /@ dt;
ListPlot[dt2, Joined -> True, BaseStyle -> Thick]

enter image description here

ListPlot[dt2, Joined -> True, PlotStyle -> Directive[Thick, Blue]]

enter image description here

Or, less conveniently, post-process the plot output

lplt1 = ListPlot[dt, PlotRange -> {{50, 650}, {50, 350}}, Joined -> True, 
   AxesLabel -> {"Temperature in, [K]", "Temptature drop, [K]"}, PlotStyle -> Thick] ;
Normal[lplt1] /. Line[x_] :> (Line[Join[x, {Through@{Max, Min}@x, x[[1]]}]])

or

Normal[lplt1] /. Line[x_] :> {Thick, Blue, Line[Join[x, {Through@{Max, Min}@x, x[[1]]}]]}

to get the first and second pictures above.

Update:

make the artificially added vertical and horizontal part of the triangle ... not thick
(or) to put the dots back on

Normal[lplt1] /. Line[x_] :> {Thick, Blue, Line[x], PointSize[Large], Point[x], 
                          Thin, Line[{x[[1]], Through@{Max, Min}@x, x[[2]]}]}

enter image description here

added 302 characters in body
Source Link
kglr
  • 400.5k
  • 18
  • 488
  • 929

You can pre-process the input data to ListPlot

lplt1dt = ListPlot[Transpose[Transpose[{tempDrop /@ HePure, tempDrop /@ HeO2Mix}];
dt2 = Join[#, {Through@{Max, Min}@#, #[[1]]}] & /@ dt;
ListPlot[dt2, Joined -> True, BaseStyle -> Thick]

enter image description here

ListPlot[dt2, Joined -> True, PlotStyle -> Directive[Thick, Blue]]

enter image description here

Or, less conveniently, post-process the plot output

lplt1 = ListPlot[dt, PlotRange -> {{50, 650}, {50, 350}}, Joined -> True, 
   AxesLabel -> {"Temperature in, [K]", "Temptature drop, [K]"}, PlotStyle -> Thick] ;
Normal[lplt1] /. Line[x_] :> (Line[Join[x, {Through@{Max, Min}@x, x[[1]]}]])

enter image description here

To get a single color for all triangles, you can use or

Normal[lplt1] /. Line[x_] :> {Thick, Blue, Line[Join[x, {Through@{Max, Min}@x, x[[1]]}]]}

enter image description here to get the first and second pictures above.

lplt1 = ListPlot[Transpose[{tempDrop /@ HePure, tempDrop /@ HeO2Mix}],
    PlotRange -> {{50, 650}, {50, 350}}, Joined -> True, 
   AxesLabel -> {"Temperature in, [K]", "Temptature drop, [K]"}, PlotStyle -> Thick] ;
Normal[lplt1] /. Line[x_] :> (Line[Join[x, {Through@{Max, Min}@x, x[[1]]}]])

enter image description here

To get a single color for all triangles, you can use

Normal[lplt1] /. Line[x_] :> {Thick, Blue, Line[Join[x, {Through@{Max, Min}@x, x[[1]]}]]}

enter image description here

You can pre-process the input data to ListPlot

dt = Transpose[{tempDrop /@ HePure, tempDrop /@ HeO2Mix}];
dt2 = Join[#, {Through@{Max, Min}@#, #[[1]]}] & /@ dt;
ListPlot[dt2, Joined -> True, BaseStyle -> Thick]

enter image description here

ListPlot[dt2, Joined -> True, PlotStyle -> Directive[Thick, Blue]]

enter image description here

Or, less conveniently, post-process the plot output

lplt1 = ListPlot[dt, PlotRange -> {{50, 650}, {50, 350}}, Joined -> True, 
   AxesLabel -> {"Temperature in, [K]", "Temptature drop, [K]"}, PlotStyle -> Thick] ;
Normal[lplt1] /. Line[x_] :> (Line[Join[x, {Through@{Max, Min}@x, x[[1]]}]])

or

Normal[lplt1] /. Line[x_] :> {Thick, Blue, Line[Join[x, {Through@{Max, Min}@x, x[[1]]}]]}

to get the first and second pictures above.

Source Link
kglr
  • 400.5k
  • 18
  • 488
  • 929
Loading