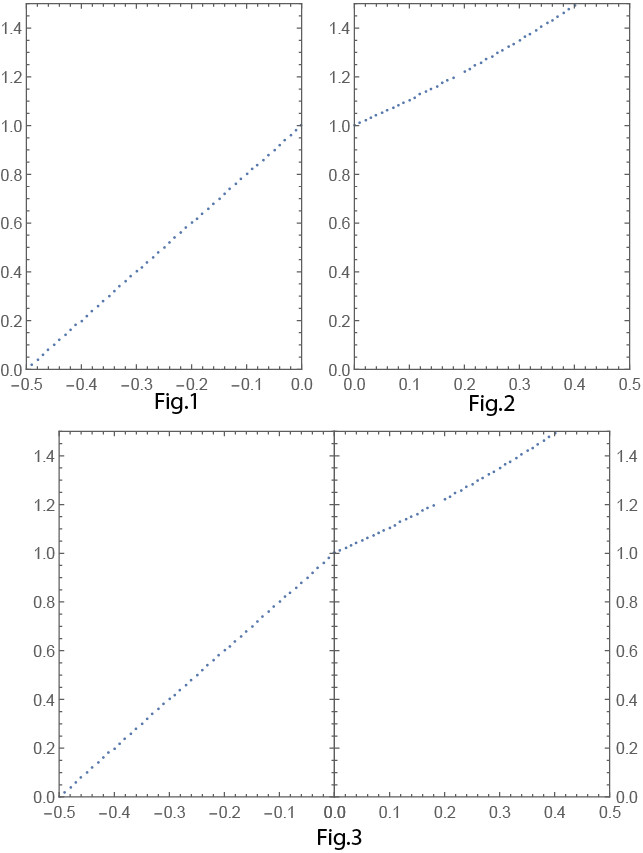
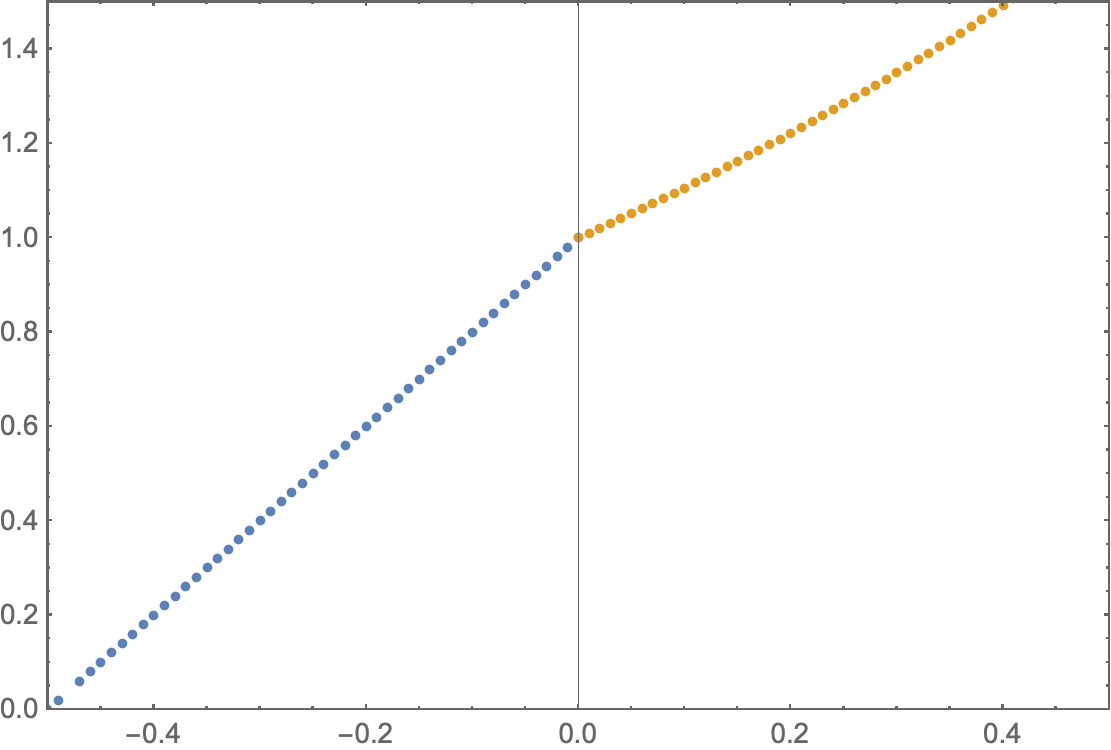
The Fig.1 and Fig.2 are generated from two lists, Fig.3 is joined and edited from Fig.1 and Fig.2 in Adobe Illustrator, the codes and figures as follows. I want to know how to get Fig.3 by Mathematica directly without being dealt in AI? Thank you!
The code:
data1 = {{-0.34,0.32},{-0.15,0.7},{0.25,0.5},{0.2,0.6},{0.33,0.34},{0.02,0.96},{-0.23,0.54},{-0.04,0.92},{-0.02,0.96},{-0.36,0.28},{0.36,0.28},{-0.33,0.34},{-0.3,0.4},{0.43,0.14},{0.07,0.86},{0.17,0.66},{0.29,0.42},{0.19,0.62},{0.12,0.76},{-0.18,0.64},{0.41,0.18},{0.27,0.46},{0.32,0.36},{-0.32,0.36},{-0.24,0.52},{-0.22,0.56},{0.23,0.54},{0.48,0.04},{-0.2,0.6},{0.3,0.4},{0.28,0.44},{-0.41,0.18},{-0.47,0.06},{0.11,0.78},{0.01,0.98},{-0.09,0.82},{0.14,0.72},{-0.43,0.14},{0.35,0.3},{-0.21,0.58},{-0.31,0.38},{-0.39,0.22},{-0.42,0.16},{-0.01,0.98},{0.06,0.88},{-0.16,0.68},{-0.03,0.94},{0.26,0.48},{0.31,0.38},{-0.06,0.88},{0.04,0.92},{-0.5,0.},{0.39,0.22},{-0.35,0.3},{-0.11,0.78},{0.21,0.58},{-0.08,0.84},{0.05,0.9},{-0.13,0.74},{0.4,0.2},{0.44,0.12},{0.37,0.26},{0.46,0.08},{-0.26,0.48},{0.13,0.74},{-0.27,0.46},{-0.46,0.08},{-0.4,0.2},{0.16,0.68},{-0.45,0.1},{-0.14,0.72},{-0.49,0.02},{0.5,0.},{0.42,0.16},{0.47,0.06},{0.09,0.82},{0.03,0.94},{0.08,0.84},{0.24,0.52},{-0.38,0.24},{0.15,0.7},{-0.44,0.12},{0.18,0.64},{-0.05,0.9},{0.1,0.8},{0.,1.},{0.22,0.56},{0.45,0.1},{-0.25,0.5},{-0.37,0.26},{-0.29,0.42},{-0.1,0.8},{0.49,0.02},{-0.19,0.62},{0.38,0.24},{-0.07,0.86},{-0.28,0.44},{0.34,0.32},{-0.17,0.66},{-0.12,0.76}};
data2 = {{-0.34,1.40495},{-0.15,1.16183},{0.25,1.28403},{0.2,1.2214},{0.33,1.39097},{0.02,1.0202},{-0.23,1.2586},{-0.04,1.04081},{-0.02,1.0202},{-0.36,1.43333},{0.36,1.43333},{-0.33,1.39097},{-0.3,1.34986},{0.43,1.53726},{0.07,1.07251},{0.17,1.1853},{0.29,1.33643},{0.19,1.20925},{0.12,1.1275},{-0.18,1.19722},{0.41,1.50682},{0.27,1.30996},{0.32,1.37713},{-0.32,1.37713},{-0.24,1.27125},{-0.22,1.24608},{0.23,1.2586},{0.48,1.61607},{-0.2,1.2214},{0.3,1.34986},{0.28,1.32313},{-0.41,1.50682},{-0.47,1.59999},{0.11,1.11628},{0.01,1.01005},{-0.09,1.09417},{0.14,1.15027},{-0.43,1.53726},{0.35,1.41907},{-0.21,1.23368},{-0.31,1.36343},{-0.39,1.47698},{-0.42,1.52196},{-0.01,1.01005},{0.06,1.06184},{-0.16,1.17351},{-0.03,1.03045},{0.26,1.29693},{0.31,1.36343},{-0.06,1.06184},{0.04,1.04081},{-0.5,1.64872},{0.39,1.47698},{-0.35,1.41907},{-0.11,1.11628},{0.21,1.23368},{-0.08,1.08329},{0.05,1.05127},{-0.13,1.13883},{0.4,1.49182},{0.44,1.55271},{0.37,1.44773},{0.46,1.58407},{-0.26,1.29693},{0.13,1.13883},{-0.27,1.30996},{-0.46,1.58407},{-0.4,1.49182},{0.16,1.17351},{-0.45,1.56831},{-0.14,1.15027},{-0.49,1.63232},{0.5,1.64872},{0.42,1.52196},{0.47,1.59999},{0.09,1.09417},{0.03,1.03045},{0.08,1.08329},{0.24,1.27125},{-0.38,1.46228},{0.15,1.16183},{-0.44,1.55271},{0.18,1.19722},{-0.05,1.05127},{0.1,1.10517},{0.,1.},{0.22,1.24608},{0.45,1.56831},{-0.25,1.28403},{-0.37,1.44773},{-0.29,1.33643},{-0.1,1.10517},{0.49,1.63232},{-0.19,1.20925},{0.38,1.46228},{-0.07,1.07251},{-0.28,1.32313},{0.34,1.40495},{-0.17,1.1853},{-0.12,1.1275}};
ListPlot[data1, PlotRange -> {{-0.5, 0}, {0, 1.5}}, Frame -> True,
 ImageSize -> 200, AspectRatio -> 4/3]
ListPlot[data2, PlotRange -> {{0, 0.5}, {0, 1.5}}, Frame -> True,
 ImageSize -> 200, AspectRatio -> 4/3]
Figure:


Jointhe data, not the plots. $\endgroup$Selectoperators on the solution below. You can easily adapt these to multiple plots. $\endgroup$