2
$\begingroup$

I would like to identify certain regions on a 3D plot. For simplicity I will give the example of a sphere (but my goals is for arbitrary data): Having defined points on a sphere via

Table[If[i^2 + j^2 + z^2 <= 1, 1, 0], {i, -2, 2, 0.1}, {j, -2, 2, 
  0.1}, {z, -2, 2, 0.1}]

I wish to plot all points marked with a 1 (in this case a sphere) on a 3D graph. This is a simple example, but in general I will have data similar to the above: a 1 for a point I wish to mark on a 3D plot, zero for a point I don't.

What would be the best way to make such a graphic?

One idea so far is: I scan the data for points marked with 1 (as opposed to 0) and create an entry in a new array {ip,jp,kp}, where these are the coordinates of the point marked by 1. I then proceed to use ListPointPlot3D[] for the new array created. Not exactly sure how to implement this in practice however... or if there is a more elegant way..

$\endgroup$
0

3 Answers 3

3
$\begingroup$
table = Table[If[i^2 + j^2 + z^2 <= 1, 1, 0], {i, -2, 2, 0.1}, {j, -2, 2, 
    0.1}, {z, -2, 2, 0.1}];

If you want to get the 3D coordinates from positions of 1 in table you can use Position

coords1 = Position[table, 1];

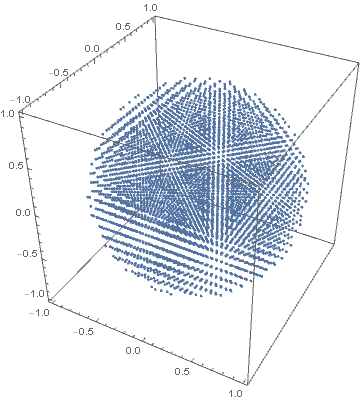
ListPointPlot3D[coords1, BoxRatios -> 1]

enter image description here

Alternatively, you can make table a SparseArray and use the property "NonzeroPositions":

coords2 = SparseArray[table]["NonzeroPositions"];

coords1 == coords2

True

$\endgroup$
3
$\begingroup$

Instead of using 1 and 0 to mark your selected points, you could instead directly generate the point triple that satisfies your condition, and use Nothing otherwise. For example:

ListPointPlot3D[Flatten[Table[If[i^2 + j^2 + z^2 <= 1, {i, j, z}, Nothing],
                              {i, -2, 2, 0.1}, {j, -2, 2, 0.1}, {z, -2, 2, 0.1}], 2], 
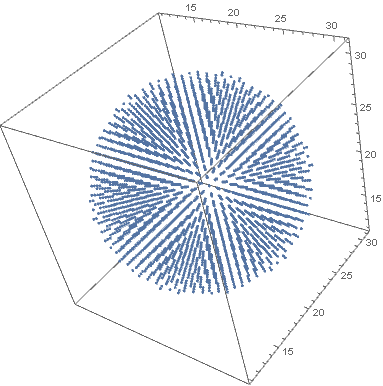
                BoxRatios -> Automatic]

points within a ball

Here, Flatten[] tidies everything up at the end so that only a list of triples is passed to ListPointPlot3D[].

$\endgroup$
2
$\begingroup$

Pick might help. Also, here a way to perform everything a bit more efficiently (because this uses packed arrays).

pts = Tuples[ConstantArray[Subdivide[-2., 2., 40], 3]];
boole = UnitStep@Subtract[1., Dot[pts^2, ConstantArray[1., 3]]];
Graphics3D[Point[Pick[pts, boole, 1]]]

This uses the coordinates from the list pts to place the points in $\mathbb{R}^3$. If you prefer to plot the integer positions, you can use, well, Position (and ArrayReshape):

Graphics3D[Point[Position[ArrayReshape[boole, {41, 41, 41}], 1]]]

The you input tensor, this work without ArrayReshape:

boole2 = Table[
   If[i^2 + j^2 + z^2 <= 1, 1, 0], 
   {i, -2, 2, 0.1}, {j, -2, 2, 0.1}, {z, -2, 2, 0.1}];
Graphics3D[Point[Position[boole2, 1]]]
$\endgroup$
3
  • $\begingroup$ Here's another way to generate pts: pts = Flatten[CoordinateBoundsArray[ConstantArray[{-2., 2.}, 3], Into[40]], 2]; this also produces a packed array. $\endgroup$ Commented Jan 25, 2020 at 22:32
  • $\begingroup$ Wow, CoordinateBoundsArray is part of the language since 2015 and I haven't heard about it, yet. oO And Into is not even documented. Interesting. Thank you! And I hope you are well! $\endgroup$ Commented Jan 25, 2020 at 23:13
  • $\begingroup$ Yes, it's really nifty for generating an nD grid of points. I'm swamped with a lot of stuff, but I am more or less okay. Thanks for the well-wishes. $\endgroup$ Commented Jan 26, 2020 at 11:43

Your Answer

By clicking “Post Your Answer”, you agree to our terms of service and acknowledge you have read our privacy policy.

Not the answer you're looking for? Browse other questions tagged or ask your own question.