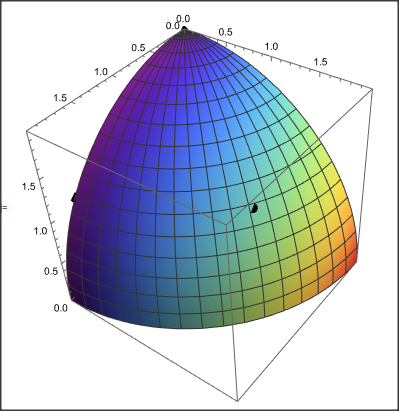
I'm very new to Mathematica. I'm trying to spherical plot a sphere from an n-row, 3-column matrix. The radius is a constant, the first and second columns are theta and phi of the points, and the last column is the (intensity) color corresponding to that theta, phi.
I have tried to interpolate {theta, phi} with intensity. My data has almost 20000 points(rows), so I just used 3 points to try. Following is my coding:
theta = {Pi/4, Pi/6, Pi/2}
phi = {Pi/6, 0, Pi/2}
intensity = {2, 1, 3}
dat = Table[{{theta[[m]], phi[[m]]}, intensity[[m]]}, {m, 1, Length[theta]}]
f = Interpolation[dat]
f[theta, phi]
points = N@ CoordinateTransformData["Spherical" -> "Cartesian", "Mapping", #] & /@ {{2, Pi/6, 0}, {2, Pi/4, Pi/6}, {2, Pi/2, Pi/2}};
Show[SphericalPlot3D[2, {theta, 0, Pi/2}, {phi, 0, Pi/2}, ColorFunction ->
   Function[{theta, phi}, ColorData["Rainbow"][f[theta, phi]]]],
 ListPointPlot3D[points, PlotStyle -> Directive[Green, PointSize -> .03]]]
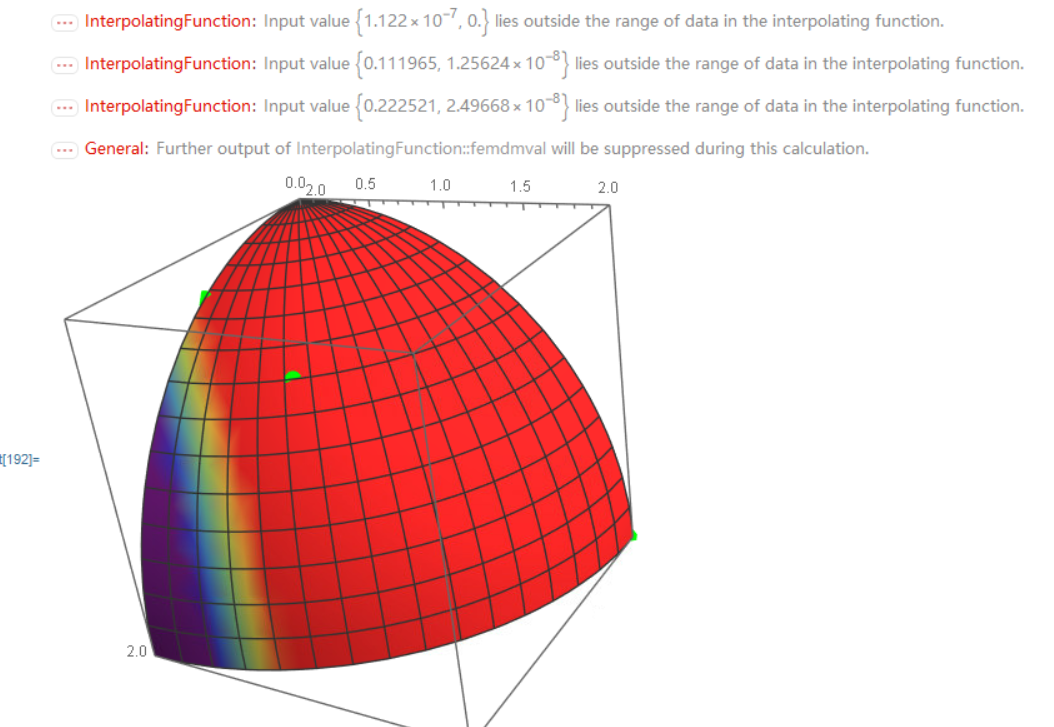
And I got the result like this

It shows my points lie outside the range of data, and the color change of the sphere seems irreverent from the original data points (the green ones I marked on the sphere).
I appreciate it a lot if you can help me solve this problem! Thanks!


Interpolationon your entire 2D array. $\endgroup$