I have data in the form:
{{0, 3, 4}, {1, 3, -1}, {2, 4, -1}, ...}
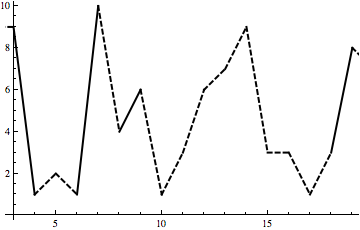
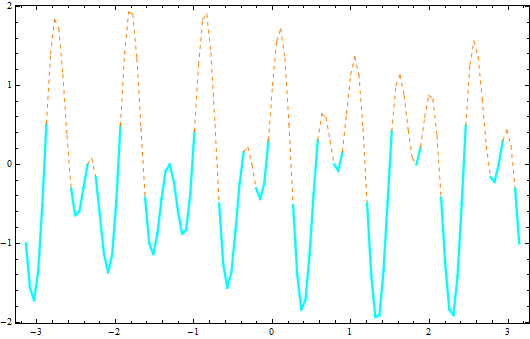
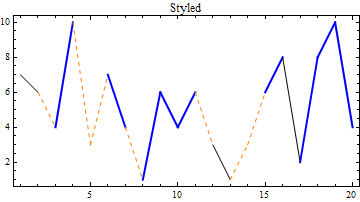
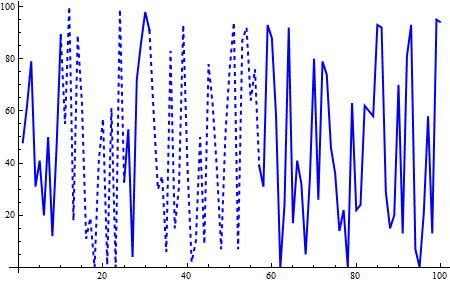
and I would like to implement something similar to ColorFunction for the style of a line. Basically I would like to plot a standard line plot using the first two entries of each point {x, y, ..}, and then decide on the line style using the 3rd {.., .., z}.
Specifically I would like to plot dashed lines when the 3rd entry is positive and filled lines when negative, formed as one continuous curve.
EDIT: to clarify, there will be large regions where the 3rd entry is consistently positive or negative, so its purpose is to set the style for those regions. This method wouldn't really work for situations where the 3rd value oscillates between the two.
Many thanks, Hemmer


