I'm having a problem with how ListPlot3D connects points. I have an array of point in the form
array={{x1,y1,z1},{x2,y2,z2},...{x,y,z}};
I use the data and ListPointPlot3D to plot my data, while this works well I am in need of creating the continuous surfaces the points make. I tried using ListPlot3D and ListSurfacePlot3D but the results are not what I wanted.
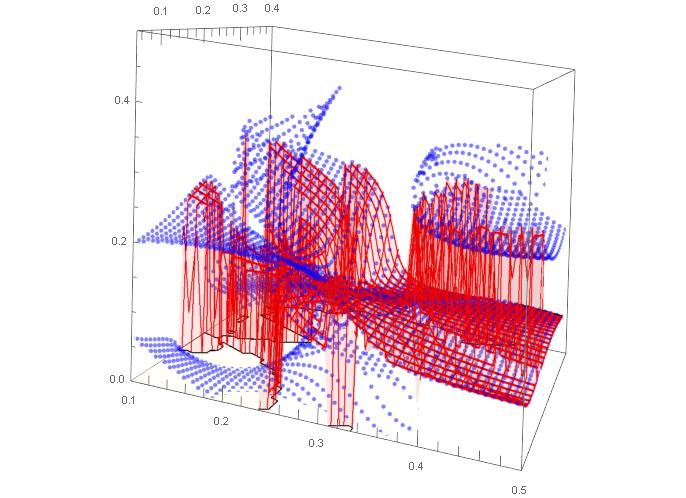
The image is created by using the following:
Show[ListPointPlot3D[spin2,PlotRange -> {{0.1, 0.5}, {0.05, 0.4}, {0.0, 0.5}},PlotLegends -> Automatic, AspectRatio -> 1,PlotStyle ->Directive[Opacity[0.5, Blue], PointSize[0.01]]],ListPlot3D[spin2, PlotRange -> {{0.1, 0.5}, {-0.1, 0.4}, {0.0, 0.4}},PlotLegends -> Automatic, Mesh ->100, MeshStyle -> {Red},AspectRatio -> 1, PlotStyle -> Directive[Opacity[0.1, Red]]]]
The blue points create smooth surfaces, but the ListPlot3D can't differentiate for points with multiple z values for the same {x,y} pair.
Any Ideas how to work around that issue?
Data is avalaible at http://www.mediafire.com/file/bjho7b5fu8j5s4n/Surface_plot_data.csv
Please note the picture is only a small part of the full data. I only need to solve the issue for this small part of the data, although it would be very useful to be able to plot smooth surfaces for the whole data set.


