1
$\begingroup$

Suppose I have the following data and associated quartiles:

data = RandomReal[{0, 1}, {40, 10}];
qs = Quartiles[data]

I want to make an ErrorListPlot from the quartiles. One approach is

toplot = Around[#[[2]], Differences@#] & /@ qs
ListLinePlot[toplot, IntervalMarkers -> "Fences"]

Is this the currently intended approach?

$\endgroup$

1 Answer 1

5
$\begingroup$

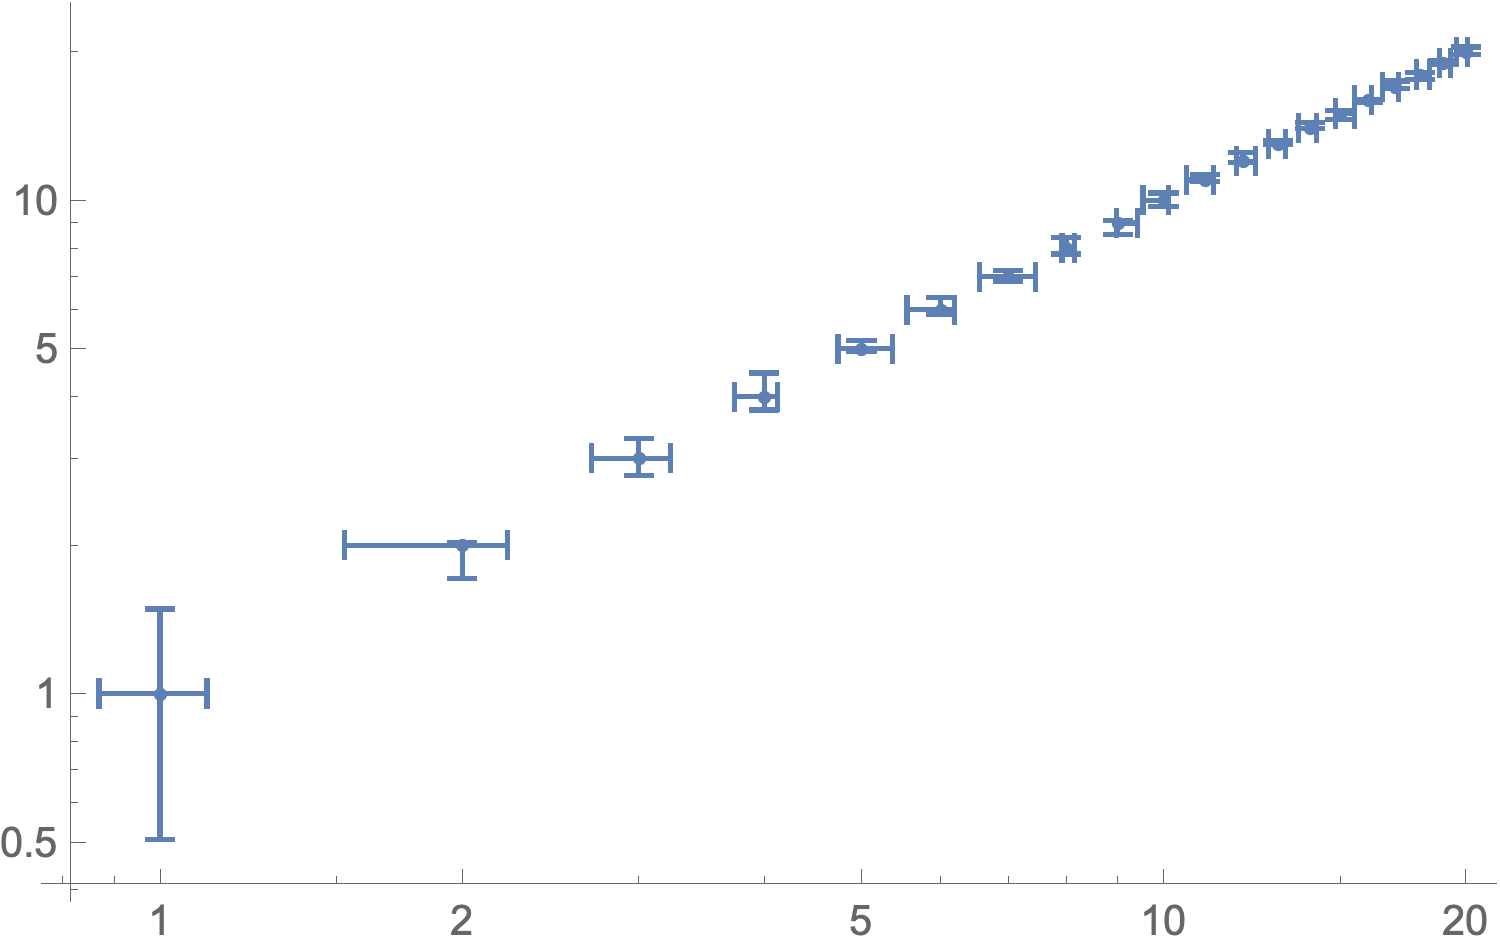
I assume that making error plots easier was a major consideration behind the move to introduce Around, so I would say that this is the intended way of constructing an error plot now.

I think it addresses two key areas (in terms of plot construction):

  1. Being able to easily add x error, y errors, or both.
  2. Being able to use error bars on Linear-Log, Log-Linear, and Log-Log graphs which was a pain before.

$ $

x = Around[#, RandomReal[{-0.5, 0.5}, 2]] & /@ Range[20];
y = Around[#, RandomReal[{-0.5, 0.5}, 2]] & /@ Range[20];
ListPlot[
 {x, y}\[Transpose],
 ScalingFunctions -> {"Log", "Log"}
]

Log-log plot with error bars.

$\endgroup$

Your Answer

By clicking “Post Your Answer”, you agree to our terms of service and acknowledge you have read our privacy policy.

Not the answer you're looking for? Browse other questions tagged or ask your own question.