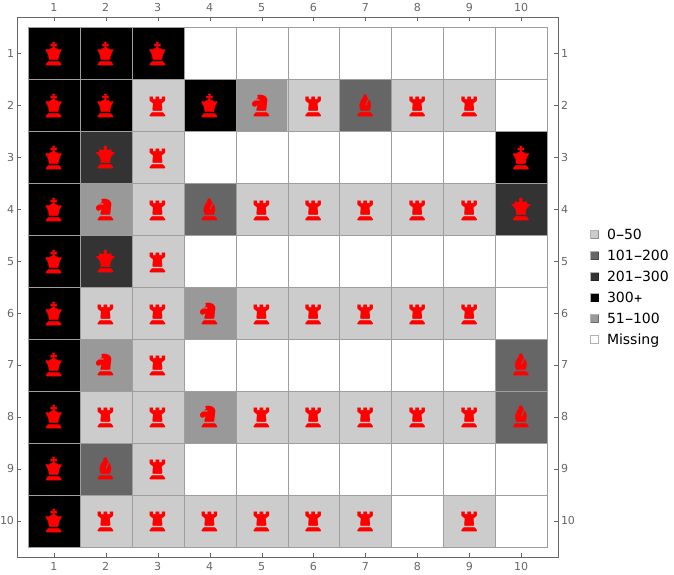
Suppose I have data like this
 data={{"300+", "300+", "300+", "Missing", "Missing", "Missing", "Missing",
  "Missing", "Missing", "Missing"}, {"300+", "300+", "0-50", "300+",
  "51-100", "0-50", "101-200", "0-50", "0-50", "Missing"}, {"300+",
  "201-300", "0-50", "Missing", "Missing", "Missing", "Missing",
  "Missing", "Missing", "300+"}, {"300+", "51-100", "0-50", "101-200",
   "0-50", "0-50", "0-50", "0-50", "0-50", "201-300"}, {"300+",
  "201-300", "0-50", "Missing", "Missing", "Missing", "Missing",
  "Missing", "Missing", "Missing"}, {"300+", "0-50", "0-50", "51-100",
   "0-50", "0-50", "0-50", "0-50", "0-50", "Missing"}, {"300+",
  "51-100", "0-50", "Missing", "Missing", "Missing", "Missing",
  "Missing", "Missing", "101-200"}, {"300+", "0-50", "0-50", "51-100",
   "0-50", "0-50", "0-50", "0-50", "0-50", "101-200"}, {"300+",
  "101-200", "0-50", "Missing", "Missing", "Missing", "Missing",
  "Missing", "Missing", "Missing"}, {"300+", "0-50", "0-50", "0-50",
  "0-50", "0-50", "0-50", "Missing", "0-50", "Missing"}};
And I want to make a grid as follows:
ArrayPlot[
   data, ColorRules -> {
            "0-50" -> GrayLevel[0.8],
            "51-100" -> GrayLevel[0.6],
            "101-200" -> GrayLevel[0.4],
            "201-300" -> GrayLevel[0.2],
            "300+" -> GrayLevel[0.],
            "Missing" -> GrayLevel[1]
         },
   ColorFunction -> Automatic, FrameTicks -> Automatic,
   PlotTheme -> "Detailed", Mesh -> True, Frame -> True, ImageSize -> Large
]
I want to place symbols in the corresponding boxes based on the following rule:
{"0-50" -> ♜, "51-100" -> ♞, "101-200" -> ♝,
 "201-300" -> ♛, "300+" -> ♚, "Missing" -> ""}

