1
$\begingroup$

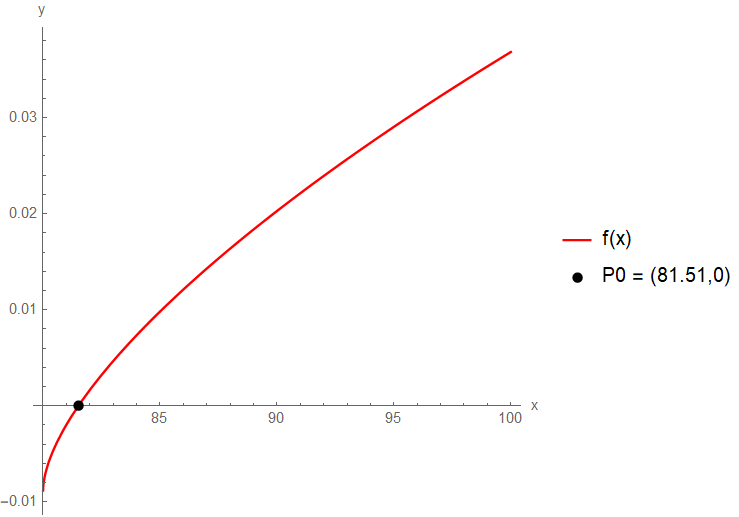
I am trying to put in a legend a value calculated previously but as you can see by your self the output is so stranger.

 f[x_] := ((3/20)^(471/100)*20/29*(x - 80))^(50/
     91) + ((3/20)^(471/100)*20/29*(x - 60))^(50/91) - 1/25
x0 = Extract[{x} /. FindRoot[f[x] == 0, {x, 80}], 1];
P0 = Point[{x0, 0}];
Gf = Plot[f[x], {x, 80, 100}, PlotStyle -> Red, AspectRatio -> 1, 
   AxesLabel -> {"x", "y"}, 
   PlotLegends -> {LineLegend[{Red}, {"f(x)"}], 
     PointLegend[{Black}, {"P0=("  x0 ",0)"}]}];
Show[Gf, Graphics[{PointSize[0.015], P0}]]

So could someone help me to put in the legend P0=(x0,0) with x0=numerical solution?

$\endgroup$
4
  • $\begingroup$ Subscript[G, f] = Plot[f[x], {x, 80, 100}, PlotStyle -> Red, AspectRatio -> 1, AxesLabel -> {"x", "y"}, PlotLegends -> {LineLegend[{Red}, {"f(x)"}], PointLegend[{Black}, {"\!\(\*SubscriptBox[\(P\), \(0\)]\)=(" <> ToString@Subscript[x, 0] <> ",0)"}]}]; $\endgroup$
    – Syed
    Commented Nov 23, 2021 at 17:17
  • $\begingroup$ @Syed Oh, thanks!!! Could I ask to you where in Wolfram Documentation can I found any information about resolution? $\endgroup$ Commented Nov 23, 2021 at 17:19
  • $\begingroup$ @Syed Okay, thanks for the help. See you soon. $\endgroup$ Commented Nov 23, 2021 at 17:23
  • 1
    $\begingroup$ I believe you want to look at NumberForm. (corrected spellings of the command and deleted the comment with the mistake). ToString@NumberForm[ x0 , {6, 3}] $\endgroup$
    – Syed
    Commented Nov 23, 2021 at 17:38

1 Answer 1

3
$\begingroup$

You can also add the point using Epilog and use a single LineLegend:

legend = LineLegend[{Red, Directive[Black, PointSize[Large]]}, 
  {"f(x)", Row[{"P0 = (", Round[x0, .01], ",", 0, ")"}]}, 
  Joined -> {True, False}]

Plot[f[x], {x, 80, 100}, PlotStyle -> Red, AspectRatio -> 1, 
 AxesLabel -> {"x", "y"},
 Epilog -> {Black, PointSize[Large], Point@{x0, 0}}, 
 PlotLegends -> legend]

enter image description here

Alternatively, use the options MeshFunctions + Mesh + MeshStyle to add the black point:

Plot[f[x], {x, 80, 100},
 PlotStyle -> Red, AspectRatio -> 1, AxesLabel -> {"x", "y"},
 MeshFunctions -> {#2 &},
 Mesh -> {{0}},
 MeshStyle -> Directive[Black, PointSize[Large]],
 PlotLegends -> legend]

enter image description here

$\endgroup$

Your Answer

By clicking “Post Your Answer”, you agree to our terms of service and acknowledge you have read our privacy policy.

Not the answer you're looking for? Browse other questions tagged or ask your own question.