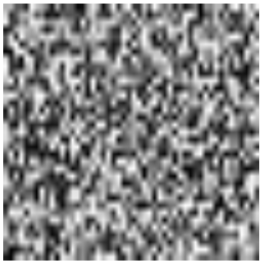
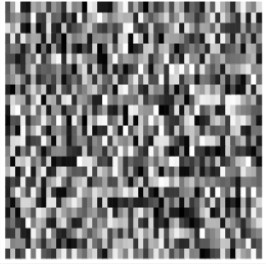
I am currently trying to export an ArrayPlot of data in vectorized form as a physically small PDF, in this case 31x256 data points into a final figure size of 180 printer's points.
For larger figure sizes, or fewer rows, the figure exports as I would expect, with rectangular pixels that correspond to the value in a particular cell.
However, below a certain feature size (achieved by either shrinking the ImageSize or increasing the number of rows), the output becomes a blurry-looking density plot rather than an exact ArrayPlot.
To demonstrate this, I have the following code which serves as a MWE. On MMA 11.1 on Windows 10 (reported screen resolution: 96 DPI), the code results in both a blurry figure in the notebook and a blurry exported figure. On MMA 11.2 on MacOS 10.13 (reported screen resolution: 144), the code results in a clear figure in the notebook but a blurry exported figure.
m = RandomReal[{0.0,1.0},{35,50}];
gr = Graphics[Raster[m], ImageSize -> 150, AspectRatio -> 1]
Export[exporDirectory <> "test.pdf",gr]
Here is a screenshot of the resulting PDF (blurriness does not change with zooming in to PDF):
While this is the expected behavior (rectangles remain sharp even when zooming in):
Increasing the ImageSize or reducing the number of rows restores the expected behavior. Changing the number of columns does not seem to have any effect (e.g. 25x50 and 25x500 both export correctly).
I understand that there are limits to what Mathematica can display in the notebook, but AFAIK, these should not apply to a PDF output.
I have tried playing with Rasterize, ImageResolution, and RasterSize, but nothing has changed the output. Unlike this question, the problem occurs on both Windows and OS X.
Is there a way to increase the "resolution" of the resulting PDF output?


Rasteris inserted into the PDF as an image. The PDF viewer needs to decide how to up/downsample this image, and often it will use a "blurry" resampler (e.g. bilinear). $\endgroup$Rasterwith a set ofRectangles if I need to make sure that it will render in a sharp way in all viewers. (Yes, it's a lot of trouble. It's best to write a utility function once and re-use it.) $\endgroup$Rasterinto a set of rectangles if the image size is sufficiently large. $\endgroup$