2
$\begingroup$

I've generated a histogram of my data, using their log values, and exported the resulting plot as pdf. To my surprise, the ticks in exported plot were replaced by the logarithm of the ticks in the histogram in the notebook (please see MWE below).
This inconsistency seems to be a bug to me. I'm using MMA 11.2 on Windows 10.

Histogram[RandomVariate[NormalDistribution[0, 1], 1000], {"Log", Automatic}]
Export["wrongTicks.pdf", %]

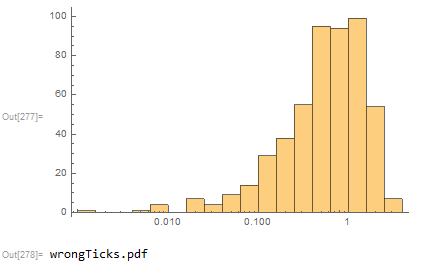
output:
enter image description here

pdf:
enter image description here

$\endgroup$
4
  • $\begingroup$ try an explicit bspec instead of automatic eg , {"Log", 10} $\endgroup$
    – george2079
    Commented Nov 3, 2017 at 15:21
  • 1
    $\begingroup$ oh yes, I tried. It doesn't work also. (Or, more precisely, it works only the first time after I switched from, for instance {"Log", {{0.001, .01, .1, 1, 10, 100}}} or {"Log", Automatic} to {"Log", 5}. The second evaluation of the same code exposes the same bug.) $\endgroup$ Commented Nov 3, 2017 at 15:51
  • 1
    $\begingroup$ ok, I cant reproduce this in v10.1. Can you see if other export formats have the same issue? $\endgroup$
    – george2079
    Commented Nov 3, 2017 at 16:28
  • $\begingroup$ seems to work as expected with all raster formats and svg. Problems are only with eps and pdf files. With eps is stable reproducible, and with pdf -- behaves unpredictable. $\endgroup$ Commented Nov 3, 2017 at 16:57

1 Answer 1

2
$\begingroup$

This bug appears to have been fixed sometime before the release of version 13.0:

enter image description here

$\endgroup$

Your Answer

By clicking “Post Your Answer”, you agree to our terms of service and acknowledge you have read our privacy policy.

Not the answer you're looking for? Browse other questions tagged or ask your own question.