14
$\begingroup$

I think there should be a simple solution for my current problem, but neither StackOverflow (or the help of Mathematica) or Google have it.

I have to plot multiple density plots with a color function.

ListAnimate[Table[
    ListDensityPlot[ListOfResults[[i]], 
        ColorFunction -> "TemperatureMap", PlotRange -> All, 
        PlotLabel -> i], 
    {i, 1, Length[ListOfResults]}], AnimationRunning -> False]

The main problem is that for each plot, the extreme colors are assigned to the maximum and minimum values of the current plot. I want the extreme values of the color function to be the global maximum of minimum of my complete data set.

$\endgroup$
0

1 Answer 1

18
$\begingroup$

You need the option ColorFunctionScaling -> False along with a color function that can handle the actual range of your data.

Given:

dat = {{1, 1, 1, 1}, {1, 2, 1, 2}, {1, 1, 3, 1}, {1, 2, 1, 4}};

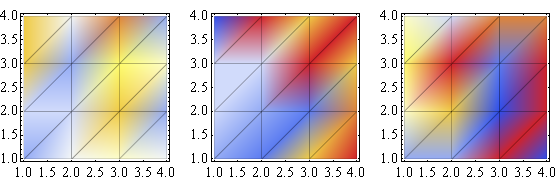
You could either divide this data by a value sufficient to get it into the range of your ColorFunction before plotting it:

ListDensityPlot[#, Mesh -> All, ColorFunction -> "TemperatureMap", 
   ColorFunctionScaling -> False] & /@ {0.1 dat, 0.2 dat, 0.3 dat}

Mathematica graphics

Or you could do this manual scaling inside your ColorFunction:

ListDensityPlot[#, Mesh -> All, 
   ColorFunction -> (ColorData["TemperatureMap"][#/10] &), 
   ColorFunctionScaling -> False] & /@ {dat, 2 dat, 3 dat}

Mathematica graphics


An effort to make this more convenient:

multiPlot[list_List, opts : OptionsPattern[]] := 
  GraphicsRow[
    ListDensityPlot[#, ColorFunctionScaling -> False, opts] & /@ 
      Rescale[list, {Min@list, Max@list}]
  ]

SeedRandom[30];

data = RandomInteger[9, {3, 4, 4}];

multiPlot[data, Mesh -> All, ColorFunction -> "TemperatureMap"]

Mathematica graphics

$\endgroup$

Your Answer

By clicking “Post Your Answer”, you agree to our terms of service and acknowledge you have read our privacy policy.

Not the answer you're looking for? Browse other questions tagged or ask your own question.