4
$\begingroup$

I am trying to plot the electric potentials of bouncing balls using the following code:

g = 0.1;
Tmax = 100;
n = 6;
pos = RandomReal[{-1, 1}, {n, 2}];
charge = RandomReal[{1, 10}, 10];

sol = NDSolve[
    Flatten@Table[{
        With[{i = i}, 
            {(x[i])''[t] == 0,
             (x[i])'[0] == 0,
             (y[i]'')[t] == -g,
             (y[i])'[0] == 0,
             x[i][0] == pos[[i, 1]],
             y[i][0] == pos[[i, 2]],
             WhenEvent[
                 y[i][t] < -1, {y[i]'[t] -> -0.95 y[i]'[t], 
                 y[i][t] -> y[i][t] + 0.05}]
             }
         ]
 }, {i, 1, n}], Flatten@Table[{x[i], y[i]}, {i, 1, n}], {t, 0, Tmax}, PrecisionGoal -> 2];

Manipulate[Graphics[
    Table[
        With[{p = Evaluate[
            {x[i][t], y[i][t]} /. First[sol]]},
        Disk[p, 0.05]], {i, 1, n}], PlotRange -> 1.05], {t, 0, Tmax}]

PotentialAnimated[x_, y_, t_] := 
    Sum[charge[[i]]/
        If[Norm[({x, y} - {x[i][t], y[i][t]} /. sol)] > 0.001, 
           Norm[({x, y} - {x[i][t], y[i][t]} /. sol)], 0.001],
    {i, 1, n}]

Manipulate[
    DensityPlot[PotentialAnimated[x, y, t], {x, -1, 1}, {y, -1, 1}], {t, 0, 10}]

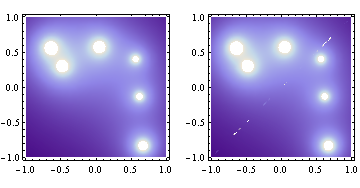
This^ last command should plot the potentials in my box caused by the charged balls jumping up and down, but I get an almost fractal looking artifact from my lower left to my upper right corner. Any ideas why this is happening ?

// part 2

not directly related but I feel like it would be a waste to start a new question just for this.

Im now trying to combine the two plots like this:

Manipulate[ Show[{DensityPlot[ PotentialAnimated[x, y, t], {x, -10, 10}, {y, -10, 10}, ColorFunction -> "SunsetColors"], Graphics[ Table[ With[{p = {x[i][t], y[i][t]} /. First[sol]}, {ColorData["TemperatureMap", (charge[[i]] + 10)/20], Disk[p, 0.5]} ] , {i, 1, n}] , PlotRange -> 10.5, Background -> Black]}], {t, 0, Tmax}]

for charges ranging from -10 to 10 , but it seems like the colors get "clipped" on the density plotclipped
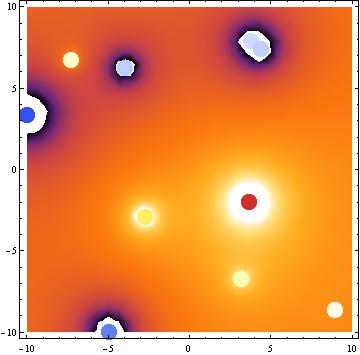
how can I fix it so colours near the balls dont just go white.

thx for the help so far

catadoxas

$\endgroup$
1
  • 1
    $\begingroup$ Please, format your code accordingly :) $\endgroup$
    – Sektor
    Commented Jun 19, 2014 at 17:22

2 Answers 2

8
$\begingroup$

This happens because sol contains the symbols x and y. These are global symbols. The function PotentialAnimated uses them without localization. There's be a conflict when DensityPlot assigns temporary values to x and y.

The fix is to localize them:

PotentialAnimated[u_, v_, t_] := 
 Block[{x, y}, 
  Sum[charge[[i]]/EuclideanDistance[{u, v}, {x[i][t], y[i][t]} /. sol[[1]]], {i, 1, n}]
 ]

This function works as expected.

But what exactly happened when x and y were not properly localized to PotentialAnimated?

Here's an result I got while experimenting with Table:

In[39]:= Table[{x, y, PotentialAnimated[x, y, 20]}, {x, {.7}}, {y, {.7}}]
Out[39]= {{{0.7, 0.7, 1035.03}}}

In[40]:= PotentialAnimated[0.7, 0.7, 20]
Out[40]= 27.7281

Table, and DensityPlot too, localizes x and y using Block. In other words, these functions assign temporary values to x and y. Due to an accident PotentialAnimated still works in this case, as it relies on ReplaceAll. It doesn't really matter if you make a replacement as x[i][t] /. {x -> ...} or 42[i][t] /. {42 -> ...}, up to the point where that magic number 42 gets repeated. This happened in your case when x became equal to y, which changed the replacement.

Hope this hastily typed up explanation is clear enough ...

Morale: don't leave dangling global symbols when defining functions. Or if you like: when using dynamic languages that support dynamic scoping, things can go wrong in weird and unexpected ways.

In your case you can try using NDSolveValue instead of NDSolve, which eliminates the need for these symbols.

$\endgroup$
1
  • $\begingroup$ Very nice. Thanks! $\endgroup$ Commented Jun 19, 2014 at 23:53
5
$\begingroup$

I was able to solve the problem by using an auxiliary function ... See Szabolcs' answer for the explanation.

PotentialAnimated[u_, v_, t_] :=  Sum[charge[[i]]/ 
               EuclideanDistance[{u, v}, {x[i][t], y[i][t]} /. sol[[1]]], {i, 1,  n}]

q[f_, x_, y_, opts : OptionsPattern[]] := DensityPlot[f, {x, -1, 1}, {y, -1, 1}, opts]

GraphicsRow[{
  q[PotentialAnimated[x, y, 10], x, y, PlotPoints -> 20,  MaxRecursion -> 5],
  DensityPlot[PotentialAnimated[x, y, 10], {x, -1, 1}, {y, -1, 1}, 
              PlotPoints -> 20, MaxRecursion -> 5]}]

Mathematica graphics

$\endgroup$
5
  • 1
    $\begingroup$ You can add Evaluated -> True or plain Evaluate the argument to fix the problem. (Yes: But why?) $\endgroup$
    – Szabolcs
    Commented Jun 19, 2014 at 23:36
  • $\begingroup$ Take a look at this ... which brings us to the solution: x and y should be localized in PotentialAnimated!! $\endgroup$
    – Szabolcs
    Commented Jun 19, 2014 at 23:45
  • $\begingroup$ @Szabolcs You may also try PotentialAnimated[u_?NumericQ, v_, t_] := ... and it always shows the imperfections $\endgroup$ Commented Jun 19, 2014 at 23:47
  • $\begingroup$ I typed it up in an answer. $\endgroup$
    – Szabolcs
    Commented Jun 19, 2014 at 23:52
  • $\begingroup$ thanks for the amazing and quick responses $\endgroup$
    – catadoxas
    Commented Jun 20, 2014 at 0:03

Your Answer

By clicking “Post Your Answer”, you agree to our terms of service and acknowledge you have read our privacy policy.

Not the answer you're looking for? Browse other questions tagged or ask your own question.