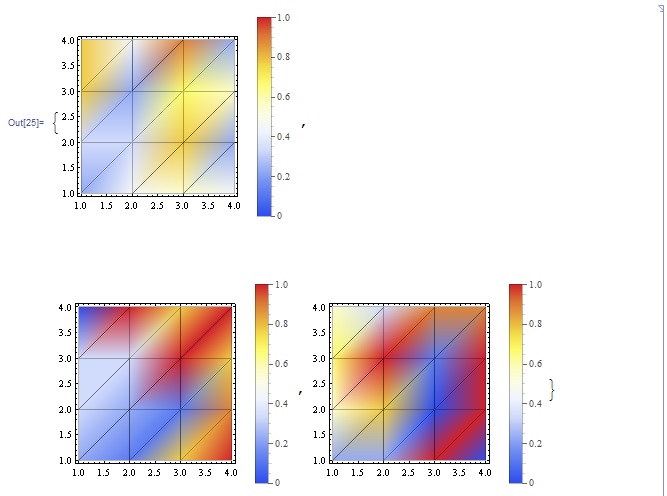
From the great answer of Mr. Wizard, I would like to learn how to implement the associated PlotLegends scaled too. Here is the simplest example with PlotLegends, which does not look to be scaled:
data = {{{2, 4, 5, 4}, {3, 3, 7, 2}, {7, 2, 6, 5}, {7, 4, 8, 2}},
        {{2, 1, 7, 9}, {3, 2, 1, 8}, {3, 3, 9, 7}, {0, 9, 7, 9}},
        {{2, 2, 9, 0}, {5, 7, 0, 9}, {6, 9, 1, 9}, {5, 3, 8, 8}}};

Table[ListDensityPlot[Rescale[data[[i]], {0, 9}],
ColorFunctionScaling -> False, Mesh -> All,
ColorFunction -> "TemperatureMap", PlotLegends -> Automatic], {i, 1, 4}]
The first legend shows a different scale from the other three.


Rescale? $\endgroup$ColorFunctionI used in this answer. Specifically, it uses the 3 argument version ofRescaleto scale the input so that it is between fixed limits. Of course, this also requires that you know a priori, the min/max of your function/list, but it is easy to workaround it if you don't. $\endgroup$