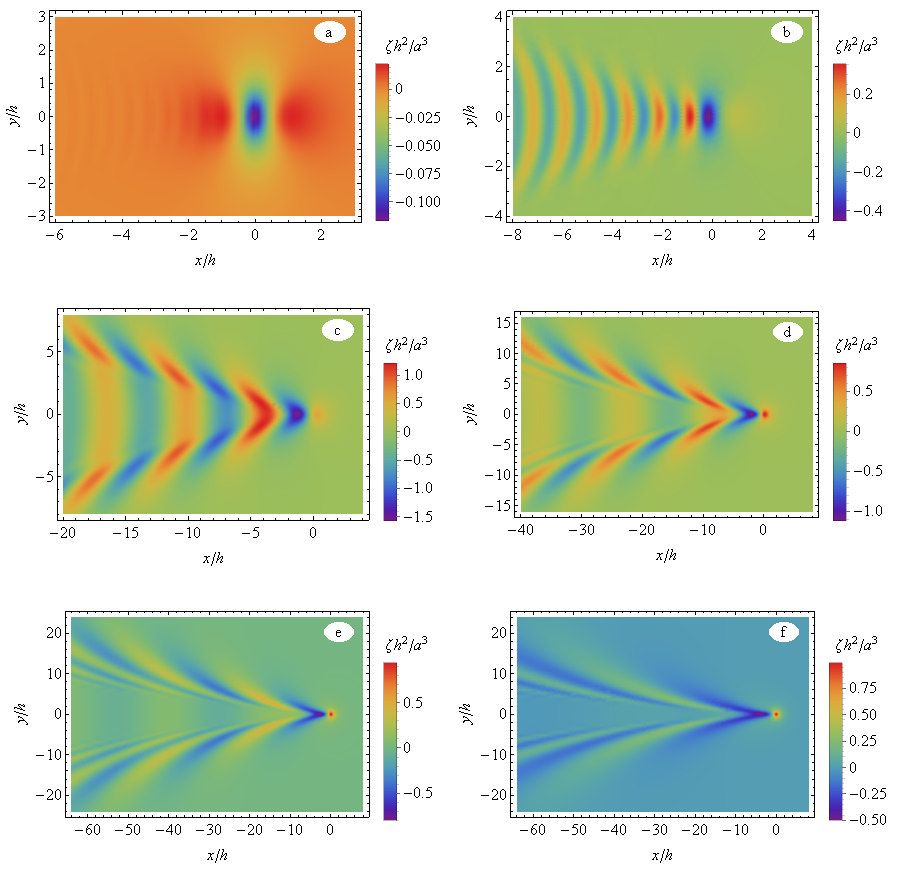
I make a set of 6 DensityPlots with PlotLegends and different sets of params:
DensityPlot[(a^3/h^2)^-1 fun[x, y, {a, h, V}, g] /. params
 , {x, xmin, xmax} /. params // Evaluate
 , {y, ymin, ymax} /. params // Evaluate
 , Frame -> True, FrameLabel -> framelbl /. params // Evaluate
 , AspectRatio -> Automatic
 , PlotRange -> All
 , ColorFunction -> "Rainbow"
 , PlotLegends -> BarLegend[Automatic
   (*,LegendFunction\[Rule]Framed*)
   , LabelStyle -> {FontSize -> 16, Black}
   , LegendLabel -> "\[Zeta]\!\(\*SuperscriptBox[
StyleBox[\"h\",\nFontSlant->\"Italic\"], \(2\)]\)/\!\(\*SuperscriptBox[
StyleBox[\"a\",\nFontSlant->\"Italic\"], \(3\)]\)"
   , LegendMarkerSize -> 180]
 , MaxRecursion -> maxrecursions /. params // Evaluate
 , PlotPoints -> plotpoints /. params // Evaluate
 , BaseStyle -> {16}
 , ImageSize -> Medium
 , Epilog -> {White, Disk[{0.9, 0.9} // Scaled, 0.05 // Scaled]
   , Black, Text[lbl, {0.9, 0.9} // Scaled] /. params // Evaluate
   }
 ]
Unfortunately, coloring of the plots turn out to be quite different because maximal and minimal values of function fun varies from plot to plot. Even zero level of fun has different color in different plots as shown below:

I guess that zero level could get same color in all pictures if ColorFunction will be scaled assuming that maximal an minimal values of fun are the same by absolute value and differs by their sign only. How to do that?
Update: Although there are several similar posts at this forum, which allows to solve my problem by preliminary computation of minimal and maximal values of plotted function I would be totally satisfied if such a computation could be automated. I mean that DensityPlot internally for sure computes these values as it by defaults scales color data to the range {0,1}. Is it possible to retrieve these internal values and feed them to ColorFunction[...,{-1,1}*Max@Abs[{InternalMin, InternalMax}]], where InternalMin and InternalMax are these internally computed values?

ColorFunctionwhich could useRescaletogether with a setting ofColorFunctionScaling -> Falsewould do what you want. $\endgroup$