I created a spline function from a list of points and made a plot as follows:
  list2 = {{3.93453, -0.623168}, {3.79708, -0.187231}, {3.72835,
  0.0307369}, {3.65963, 0.248705}, {3.5909, 0.466673}, {3.52218,
  0.684642}, {3.44186, 1.05816}, {3.36155, 1.29764}, {3.28124,
  1.5219}, {3.20093, 1.73094}, {3.12061, 1.92474}, {3.0403,
  2.10331}, {2.95999, 2.26666}, {2.87968, 2.41477}, {2.79937,
  2.54766}, {2.71905, 2.66532}, {2.63874, 2.76774}, {2.55843,
  2.85494}, {2.41254, 2.97924}, {1.98589, 3.2791}, {1.52249,
  3.51828}, {1.27967, 3.61368}, {1.03092, 3.69235}, {0.777399,
  3.75392}, {0.520275, 3.7981}, {0.260741, 3.82469}, {0., 3.83357}}

g = BSplineFunction[list2,
      SplineWeights -> {50, 50, 50, 50, 50, 50, 50, 50, 50, 50, 50, 50,
        50, 50, 50, 50, 50, 50, 50, 50, 50, 50, 50, 50, 50, 50, 50}]

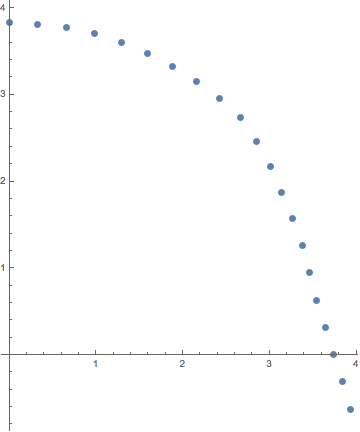
ListPlot[Table[g[t], {t, 0, 1, 1/100}]]
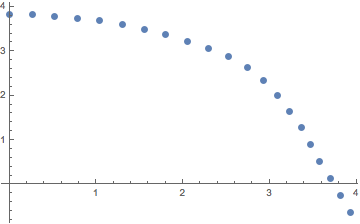
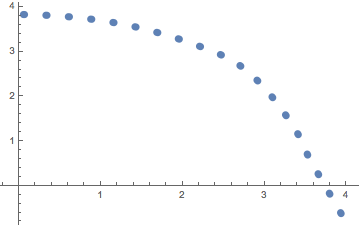
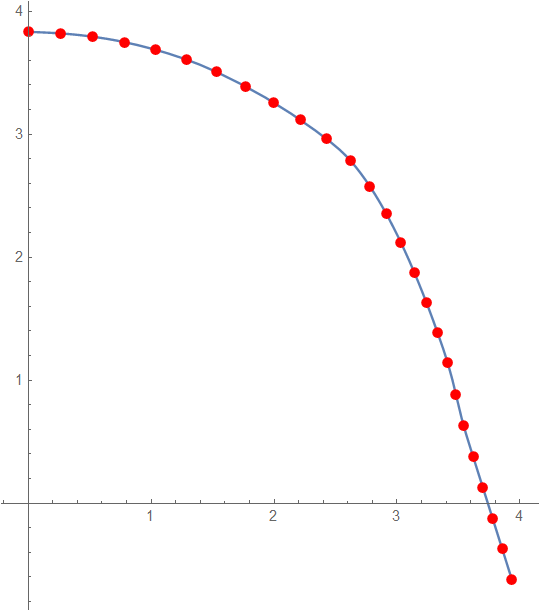
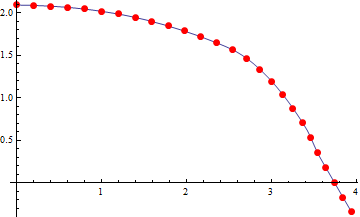
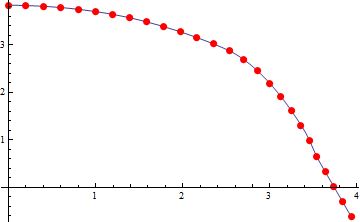
I need my plot to have more evenly placed points. When I take the plot out of this sample table to a larger scale plot, there are gaping holes that are too extreme for my needs. Is there any way to adjust the density of my spline function without just adding more points? Adding more points is not proving to be an effective solution.

g[t]. $\endgroup$AspectRationot beingAutomaticis considered (and in all answers!). If someone comes with another solution which takes into account the general case, this thread is the best place to post such an answer. $\endgroup$