5
$\begingroup$

enter image description here

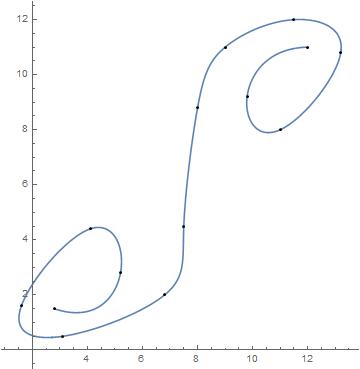
Hi, I would like to find 10 coordinates between each points of this spline interpolation. I have done some research, but cannot find an appropriate answer. Any help will be appreciated.

pts = {{2.8, 1.5}, {5.2, 2.8}, {4.1, 4.4}, {1.6, 1.6}, {3.1, 0.5}, {6.8, 2}, {7.5, 4.5}, 
 {8, 8.8}, {9, 11}, {11.5, 12}, {13.2, 10.8}, {11, 8}, {9.8, 9.2}, {12, 11}};
{xs, ys} = Transpose[pts];
xinterp = Interpolation[xs, Method -> "Spline"];
yinterp = Interpolation[ys, Method -> "Spline"];
ParametricPlot[{xinterp[t], yinterp[t]}, {t, 1, Length@pts}, 
Epilog -> Point /@ pts]
$\endgroup$
1
  • 1
    $\begingroup$ Table[{xinterp[t], yinterp[t]}, {t, 1, Length@pts, 1/11}] $\endgroup$
    – Karsten7
    Commented Sep 22, 2015 at 5:48

1 Answer 1

5
$\begingroup$

As Karsten mentions in a comment to your question,

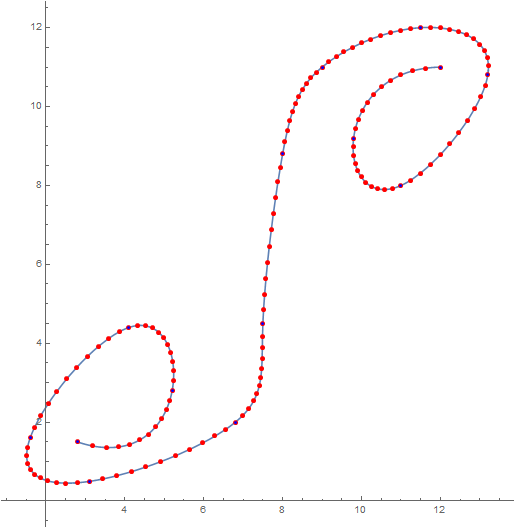
morePts = Table[{xinterp[t], yinterp[t]}, {t, 1, Length@pts, 1/11}];

will give you original points along with the addition points you asked for. The plot of the curve with the additional points is given by

ParametricPlot[{xinterp[t], yinterp[t]}, {t, 1, Length @ pts}, 
 Epilog -> {Red, AbsolutePointSize[5], Point[morePts], 
  Blue, AbsolutePointSize[3], Point[pts]}]

plot

$\endgroup$
1
  • $\begingroup$ Thanks! This is what I have been looking for. I really appreciate it =) $\endgroup$
    – Lila
    Commented Sep 22, 2015 at 17:01

Your Answer

By clicking “Post Your Answer”, you agree to our terms of service and acknowledge you have read our privacy policy.

Not the answer you're looking for? Browse other questions tagged or ask your own question.