0
$\begingroup$

I want to get 256 points exponentially sampled in a range, and then get its histogram.

If I plot PDF, I get the following:

Plot[Table[PDF[ExponentialDistribution[\[Lambda]], x], {\[Lambda], {10}}] // Evaluate, {x, 0, 0.5}, Filling -> Axis, PlotRange -> All]

But when I try to get a list, I am not sure how to proceed:

list = N[Table[PDF[ExponentialDistribution[1/10], x], {x, 0, 0.5}]] //Sort
Histogram[list]
$\endgroup$

2 Answers 2

1
$\begingroup$

You could use:

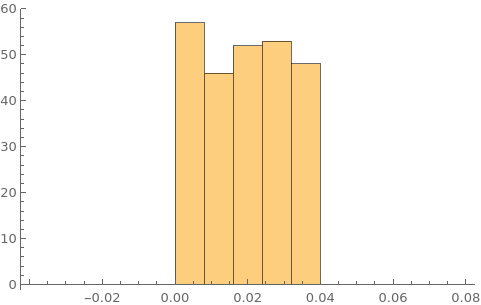
trdist = TruncatedDistribution[{0, 0.04}, ExponentialDistribution[10]];
sample = RandomVariate[trdist, 256];

Histogram[sample, {Subdivide[-0.04, 0.08, 15]}]

hist

$\endgroup$
1
$\begingroup$

You can use RandomVariate to generate samples for given distributions.

sample = RandomVariate[ExponentialDistribution[1/10], 10000] ;
Show[Histogram[sample,100,"ProbabilityDensity"],Plot[PDF[ExponentialDistribution[1/10],x],{x,0,50}]]
$\endgroup$
4
  • $\begingroup$ I also want to specify the range like 256 exponentially distributed points with decay constant as 10 (or any other number) but ranging between 0 and 30 only. $\endgroup$
    – tabi_k
    Commented Jul 7, 2020 at 7:02
  • 3
    $\begingroup$ @tabi_k Maybe with TruncatedDistribution ? $\endgroup$ Commented Jul 7, 2020 at 12:04
  • 1
    $\begingroup$ TruncatedDistribution[{0, 0.04}, RandomVariate[ExponentialDistribution[10], 256]] Didn't work @b.gates.you.know.what $\endgroup$
    – tabi_k
    Commented Jul 8, 2020 at 6:02
  • $\begingroup$ @tabi_k Please see answer. $\endgroup$ Commented Jul 8, 2020 at 9:02

Your Answer

By clicking “Post Your Answer”, you agree to our terms of service and acknowledge you have read our privacy policy.

Not the answer you're looking for? Browse other questions tagged or ask your own question.