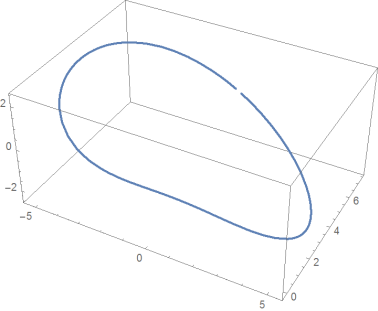
I have coordinates of points that represent a curve (for example, helix or centerline of moebius strip) in $ \mathbb{R^3}$. I want to fit a Bspline through these points. How to do this in Mathematica?
Example of curve: see at the end
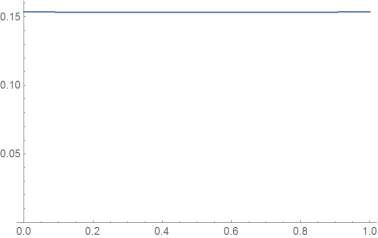
I get noisy values for curvature and torsion of this curve if I use the pts as control points of BSplineCurve function.
Also, I have used Interpolation function, with that too, computed curvature and torsion are noisy.
The real data I want to fit:
{{-0.127862, 7.23797, 0.080385}, {-0.386039, 7.22523,
  0.238487}, {-0.643736, 7.19972, 0.395825}, {-0.900618, 7.16136,
  0.551879}, {-1.15633, 7.11002, 0.706108}, {-1.4105, 7.04555,
  0.857945}, {-1.66271, 6.96778, 1.00679}, {-1.9125, 6.8765,
  1.15199}, {-2.15936, 6.77151, 1.29287}, {-2.40271, 6.6526,
  1.42869}, {-2.64192, 6.51958, 1.55865}, {-2.87627, 6.37229,
  1.68191}, {-3.10494, 6.21063, 1.79756}, {-3.32704, 6.03455,
  1.90464}, {-3.54155, 5.84411, 2.00217}, {-3.74738, 5.63948,
  2.08911}, {-3.9433, 5.42099, 2.1644}, {-4.12798, 5.18913,
  2.227}, {-4.30001, 4.94459, 2.27587}, {-4.45787, 4.68829,
  2.31007}, {-4.59997, 4.42139, 2.3287}, {-4.72468, 4.14532,
  2.33102}, {-4.83036, 3.8618, 2.31646}, {-4.91539, 3.57279,
  2.28468}, {-4.9782, 3.28055, 2.23561}, {-5.01738, 2.98756,
  2.16947}, {-5.03167, 2.69648, 2.08687}, {-5.02007, 2.41015,
  1.98876}, {-4.98187, 2.13143, 1.87651}, {-4.9167, 1.86318,
  1.75186}, {-4.82458, 1.60813, 1.61691}, {-4.70594, 1.36881,
  1.47412}, {-4.56163, 1.14739, 1.32615}, {-4.39291, 0.945657,
  1.17587}, {-4.2014, 0.764887, 1.02622}, {-3.98905, 0.605816,
  0.880086}, {-3.75804, 0.4686, 0.740214}, {-3.51073, 0.352823,
  0.609092}, {-3.24952, 0.257522, 0.488851}, {-2.97682, 0.181251,
  0.381183}, {-2.6949, 0.122163, 0.287282}, {-2.40588, 0.0781093,
  0.207801}, {-2.11161, 0.0467557, 0.142845}, {-1.81367, 0.0256998,
  0.0919741}, {-1.51331, 0.0125879, 0.0542331}, {-1.21151, 0.00522497,
   0.0282002}, {-0.908944, 0.00167311, 0.0120463}, {-0.60604,
  0.00033535, 0.00360597}, {-0.303029, 0.0000222426, 0.000456223}, {0,
   0, 0}, {0, 0, 0}, {0.303029, 0.000022046, -0.000449164}, {0.606041,
   0.000333794, -0.00357979}, {0.908945,
  0.00166793, -0.0119886}, {1.21151, 0.00521293, -0.028099}, {1.51332,
   0.012565, -0.0540773}, {1.81368, 0.0256614, -0.0917535}, {2.11165,
  0.0466967, -0.142551}, {2.40594, 0.0780248, -0.207425}, {2.69499,
  0.122048, -0.286817}, {2.97694, 0.181102, -0.380626}, {3.24969,
  0.257335, -0.488198}, {3.51095, 0.352596, -0.608342}, {3.75834,
  0.468332, -0.739366}, {3.98943, 0.605506, -0.879142}, {4.20188,
  0.764539, -1.02518}, {4.39349, 0.945273, -1.17475}, {4.56232,
  1.14698, -1.32494}, {4.70675, 1.36837, -1.47283}, {4.82551,
  1.60768, -1.61555}, {4.91775, 1.86271, -1.75043}, {4.98305,
  2.13096, -1.87502}, {5.02137, 2.40969, -1.98722}, {5.0331,
  2.69604, -2.08527}, {5.01892, 2.98713, -2.16782}, {4.97985,
  3.28015, -2.23391}, {4.91715, 3.57242, -2.28293}, {4.83222,
  3.86146, -2.31467}, {4.72663, 4.14502, -2.32918}, {4.602,
  4.42112, -2.32682}, {4.45998, 4.68806, -2.30815}, {4.30219,
  4.9444, -2.27392}, {4.13022, 5.18897, -2.225}, {3.94559,
  5.42087, -2.16236}, {3.74972, 5.63939, -2.08703}, {3.54394,
  5.84404, -2.00006}, {3.32946, 6.03451, -1.90249}, {3.1074,
  6.21061, -1.79537}, {2.87875, 6.37229, -1.67969}, {2.64443,
  6.51959, -1.5564}, {2.40524, 6.65262, -1.42641}, {2.1619,
  6.77154, -1.29057}, {1.91506, 6.87653, -1.14966}, {1.66529,
  6.96781, -1.00444}, {1.41309, 7.04558, -0.855578}, {1.15893,
  7.11005, -0.703726}, {0.903221, 7.16138, -0.549484}, {0.646343,
  7.19974, -0.393421}, {0.38865, 7.22524, -0.236076}, {0.130474,
  7.23797, -0.077971}, {-0.127862, 7.23797, 0.080385}}


Graphics3D[ BSplineCurve[pts] ]only gives a Graphics3D object. How did you calculate curvature and torsion? $\endgroup$Ifnis the interpolated function. Curvature:curvK = (Dot[Cross[Ifn''[t], Ifn'[t]] , Cross[Ifn'[t], Ifn'[t]]]/ (Dot[Ifn'[t], Ifn'[t]])^3 )^(1/2)Torsion of curve:torsionT = Dot[ Cross[Ifn'[t] , Ifn''[t]], Ifn'''[t]] / Dot[ Cross[Ifn'[t], Ifn''[t]] , Cross[Ifn'[t], Ifn'[t]] ]$\endgroup$Ifn[t]? $\endgroup$